NVO: Harmonic Pattern Signals Potential ReversalNVO: Harmonic Pattern Signals Potential Reversal
Novo Nordisk (NVO) has completed a Bullish Harmonic Pattern, suggesting that a potential reversal phase may already be underway.
If the pattern holds, we could see a short consolidation before a potential rally toward the first target near 53.50, f
Next report date
—
Report period
—
EPS estimate
—
Revenue estimate
—
13.32 PLN
57.83 B PLN
166.31 B PLN
3.17 B
About Novo Nordisk A/S Class B
Sector
Industry
CEO
Maziar Mike Doustdar
Website
Headquarters
Bagsværd
Founded
1923
ISIN
DK0062498333
FIGI
BBG01VCLYS74
Novo Nordisk A/S is a global healthcare company, which engages in the discovery, development, manufacturing and marketing of pharmaceutical products. It operates through the Diabetes and Obesity Care, and Rare Disease segments. The Diabetes and Obesity Care segment includes diabetes, obesity, cardiovascular, and emerging therapy areas. The Rare Disease segment refers to rare blood disorders, rare endocrine disorders, and hormone replacement therapy. The company was founded by Harald Pedersen and Thorvald Pedersen in 1923 is headquartered in Bagsværd, Denmark.
Related stocks

$NVO Short Setup | EMA Wall Stops Bulls, Downside Active🎯 NVO Bearish Breakdown: 200 EMA Rejection Setup 🐻
📊 Asset Overview
Novo Nordisk (NVO) - NYSE
Type: Swing/Day Trade Opportunity
Bias: Bearish Reversal Confirmed ⚠️
🔍 Technical Analysis
The bulls just got rejected harder than a bad pickup line at the 200 EMA! 📉 We're seeing strong bearish momentum

NVO-Bullish stillAs long as we don’t go below 200 monthly EMA and weekly bullish divergent structure still unbroken.
Expecting double bottom reversal to the upside.
Still hodl and pray

$NVO RSI Oversold + sitting at 5 year support, amazing R/R NYSE:NVO RSI Oversold + sitting at 5 year support, amazing R/R + Cash Cow

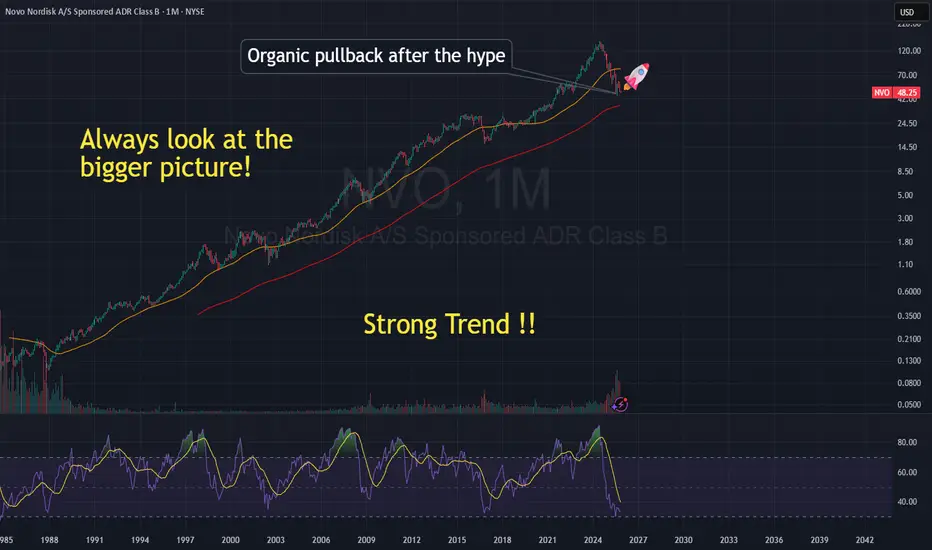
$NVO Last opportunity!🌱 Novo Nordisk: A Healthy Pullback in a Long-Term Growth Story
After years of remarkable growth, Novo Nordisk (NYSE: NVO) has seen its stock cool off — sliding from over 💲130 to around 💲49. At first glance, that might look alarming, but the reality is far more balanced. What we’re seeing is an or
NVO holding the double bottomNVO is holding a double bottom constructively here, with a negative divergence on RSI. Price has shown strength out of the bottom which is a compelling sign. The $44.50 level needs to be watched, a break would negate the pattern.

Novo Nordisk longThis trade is a bullish setup on Novo Nordisk (NVO) aiming for an upward movement from around $50. The chart uses Fibonacci targets:
Target 1: $55
Target 2: $65.53
Target 3: $81.21
Volume shows recent accumulation, and entry is near strong support (around $45-$50).

NVO Swing LongFew ways to approach this trade. Look for previous lows at 45 to get taken and look to swing long once back above. More conservative approach would be to wait for a monthly close back above 56.46 as that would confirm a HTF change trend where one should look to buy on pullbacks. If price takes the l

NVO Longdemand Zone
Long entry 45.8
Stop 43,
Target 62,70
Risk management is much more important than a good entry point.
I am not a PRO trader.
In my trading plan, the Max Risk of each short term trade should be less than 1% of an account.

Novo Nordisk selloff an opportunity if markets slumpMarkets are stretched. Tech and AI have run hot. If sentiment breaks, investors will pivot fast. Novo Nordisk offers safety, scale, and cashflow. But this isn’t a flawless story.
Novo’s stock has pulled back. Some of that is market-driven. But part of it is real. Growth expectations were stretched.

See all ideas
Summarizing what the indicators are suggesting.
Neutral
SellBuy
Strong sellStrong buy
Strong sellSellNeutralBuyStrong buy
Neutral
SellBuy
Strong sellStrong buy
Strong sellSellNeutralBuyStrong buy
Neutral
SellBuy
Strong sellStrong buy
Strong sellSellNeutralBuyStrong buy
An aggregate view of professional's ratings.
Neutral
SellBuy
Strong sellStrong buy
Strong sellSellNeutralBuyStrong buy
Neutral
SellBuy
Strong sellStrong buy
Strong sellSellNeutralBuyStrong buy
Neutral
SellBuy
Strong sellStrong buy
Strong sellSellNeutralBuyStrong buy
N
XS300255582
Novo Nordisk Finance (Netherlands) BV 3.625% 27-MAY-2037Yield to maturity
3.70%
Maturity date
May 27, 2037
N
XS282046075
Novo Nordisk Finance (Netherlands) BV 3.375% 21-MAY-2034Yield to maturity
3.43%
Maturity date
May 21, 2034
N
XS300255353
Novo Nordisk Finance (Netherlands) BV 3.125% 27-MAY-2033Yield to maturity
3.26%
Maturity date
May 27, 2033
N
XS282045567
Novo Nordisk Finance (Netherlands) BV 3.25% 21-JAN-2031Yield to maturity
3.03%
Maturity date
Jan 21, 2031
N
XS300255329
Novo Nordisk Finance (Netherlands) BV 2.875% 27-AUG-2030Yield to maturity
2.96%
Maturity date
Aug 27, 2030
XS244124704
Novo Nordisk Finance (Netherlands) BV 1.375% 31-MAR-2030Yield to maturity
2.81%
Maturity date
Mar 31, 2030
N
XS300255299
Novo Nordisk Finance (Netherlands) BV 2.375% 27-MAY-2028Yield to maturity
2.73%
Maturity date
May 27, 2028
N
XS282045460
Novo Nordisk Finance (Netherlands) BV 3.125% 21-JAN-2029Yield to maturity
2.73%
Maturity date
Jan 21, 2029
XS234803042
Novo Nordisk Finance (Netherlands) BV 0.125% 04-JUN-2028Yield to maturity
2.63%
Maturity date
Jun 4, 2028
N
XS282044994
Novo Nordisk Finance (Netherlands) BV 3.375% 21-MAY-2026Yield to maturity
2.48%
Maturity date
May 21, 2026
XS244933017
Novo Nordisk Finance (Netherlands) BV 1.125% 30-SEP-2027Yield to maturity
2.39%
Maturity date
Sep 30, 2027
See all NVO bonds
Curated watchlists where NVO is featured.


Frequently Asked Questions
The current price of NVO is 175.98 PLN — it has decreased by −1.29% in the past 24 hours. Watch Novo Nordisk A/S Class B stock price performance more closely on the chart.
Depending on the exchange, the stock ticker may vary. For instance, on GPW exchange Novo Nordisk A/S Class B stocks are traded under the ticker NVO.
NVO stock has risen by 3.80% compared to the previous week, the month change is a −13.71% fall, over the last year Novo Nordisk A/S Class B has showed a −30.72% decrease.
We've gathered analysts' opinions on Novo Nordisk A/S Class B future price: according to them, NVO price has a max estimate of 305.19 PLN and a min estimate of 152.59 PLN. Watch NVO chart and read a more detailed Novo Nordisk A/S Class B stock forecast: see what analysts think of Novo Nordisk A/S Class B and suggest that you do with its stocks.
NVO stock is 1.87% volatile and has beta coefficient of 1.58. Track Novo Nordisk A/S Class B stock price on the chart and check out the list of the most volatile stocks — is Novo Nordisk A/S Class B there?
Today Novo Nordisk A/S Class B has the market capitalization of 786.78 B, it has increased by 9.16% over the last week.
Yes, you can track Novo Nordisk A/S Class B financials in yearly and quarterly reports right on TradingView.
Novo Nordisk A/S Class B is going to release the next earnings report on Feb 4, 2026. Keep track of upcoming events with our Earnings Calendar.
NVO earnings for the last quarter are 2.57 PLN per share, whereas the estimation was 2.79 PLN resulting in a −8.11% surprise. The estimated earnings for the next quarter are 3.40 PLN per share. See more details about Novo Nordisk A/S Class B earnings.
Novo Nordisk A/S Class B revenue for the last quarter amounts to 42.79 B PLN, despite the estimated figure of 43.67 B PLN. In the next quarter, revenue is expected to reach 44.54 B PLN.
NVO net income for the last quarter is 11.42 B PLN, while the quarter before that showed 15.07 B PLN of net income which accounts for −24.23% change. Track more Novo Nordisk A/S Class B financial stats to get the full picture.
Novo Nordisk A/S Class B dividend yield was 1.83% in 2024, and payout ratio reached 50.28%. The year before the numbers were 1.35% and 50.35% correspondingly. See high-dividend stocks and find more opportunities for your portfolio.
As of Nov 18, 2025, the company has 76.3 K employees. See our rating of the largest employees — is Novo Nordisk A/S Class B on this list?
EBITDA measures a company's operating performance, its growth signifies an improvement in the efficiency of a company. Novo Nordisk A/S Class B EBITDA is 89.16 B PLN, and current EBITDA margin is 50.95%. See more stats in Novo Nordisk A/S Class B financial statements.
Like other stocks, NVO shares are traded on stock exchanges, e.g. Nasdaq, Nyse, Euronext, and the easiest way to buy them is through an online stock broker. To do this, you need to open an account and follow a broker's procedures, then start trading. You can trade Novo Nordisk A/S Class B stock right from TradingView charts — choose your broker and connect to your account.