Grass scalp short to $1.76 areaJust opened a scalp short position on #GRASS
Target $1.76 area
stop: $2.0085 or higher
Roughly 2 RR
My Dtt strategy applied
#grassusdt

GRASS Looks Bullish (1D)It appears that a triangle has completed and the B-D resistance line has been broken. Buy/long positions can be considered during pullbacks.
We have identified two entry points for potential entries.
Targets are marked on the chart.
A daily candle closing below the invalidation level will invalid

Grass short to $1.7755Another attempt on grass short. This time with big ass stop. Will look to scale in later on maybe given I see a more decisive move in my favor.
Time sensitive, see chart for stop and targets

$GRASS - Long SetupBYBIT:GRASSUSDT | 12h
We shared a detailed long setup on this one last week, and it's now up 66%
If $1.80 holds as support or flips cleanly, $GRASS could push toward $2.50 or even extend to $3.30
I'll be watching for a re-long opportunity in the $1.90–$1.80 zone
Set stoploss just below $1.60

GRASS PERPETUAL TRADE, Sold From $2.20GRASS PERPETUAL TRADE
GRASS SELL SETUP
Currently $2.20
Sold From $2.20
(Trading plan If GRASS go up to $2.34
will add more shorts)
Expecting target $2.08 OR DOWN
Incase of early exist will update this anaylsis
Its not a Financial advice

"Scalp Shorting GRASS at CMP Entry Plan Inside!"📉 Scalp Short Setup: #GRASS
⚙️ Leverage: 5x to 6x
🟢 Entry 1: CMP - 1.8650
🟢 Entry 2: 1.9000
🎯 Take Profits:
TP 1: 1.8464
TP 2: 1.8277
TP 3: 1.8091
TP 4: 1.7718
TP 5: 1.7345
TP 6: 1.6972
🔴 Stop Loss: 2hr Close Above 1.9330 (~2.7%)
📌 TP's & SL will be updated as price action d

Grass long to $1.7128Just recently opened a long position on grass. Target is $1.7128
Stop: $1.5684 or lower.
Roughly 3RR from my entry.
It might correct down a bit for better if you just seeing this.. or not.

$GRASS - Long Trade IdeaBYBIT:GRASSUSDT | 8h
Scaling into long, might add if it dips a bit to 1.42
Stop just below the low 1.34
TPs:
1.47-1.54
1.58-1.67
1.80-1.90

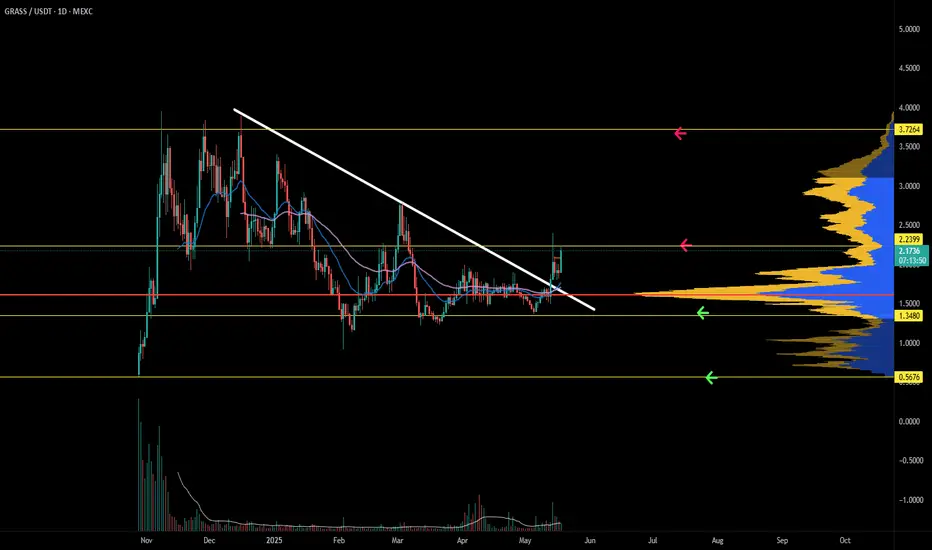
Grass is moving on up. GRASS broke an important trendline but did not confirm a proper high high. Momentum is entering overbought conditions, and the trend oscillator is still showing strength to the upside. Lower timeframe dips should be avoided. Until the Daily timeframe is not overbought, more upside is still possible.
GRASSUSDT 1D Analysis GRASS ~ 1D Analysis
#GRASS Buy after successfully breaking this resistance line with a short term target of at least 10%+ from here.

See all ideas
Summarizing what the indicators are suggesting.
Oscillators
Neutral
SellBuy
Strong sellStrong buy
Strong sellSellNeutralBuyStrong buy
Oscillators
Neutral
SellBuy
Strong sellStrong buy
Strong sellSellNeutralBuyStrong buy
Summary
Neutral
SellBuy
Strong sellStrong buy
Strong sellSellNeutralBuyStrong buy
Summary
Neutral
SellBuy
Strong sellStrong buy
Strong sellSellNeutralBuyStrong buy
Summary
Neutral
SellBuy
Strong sellStrong buy
Strong sellSellNeutralBuyStrong buy
Moving Averages
Neutral
SellBuy
Strong sellStrong buy
Strong sellSellNeutralBuyStrong buy
Moving Averages
Neutral
SellBuy
Strong sellStrong buy
Strong sellSellNeutralBuyStrong buy
Displays a symbol's price movements over previous years to identify recurring trends.