GRTUSDT Triangle Coil Tension Builds Bullish Breakout in FocusGRTUSDT is forming a clean symmetrical triangle with price rebounding from the lower trendline which brings an encouraging signal for potential continuation to the upside.
As long as the structure holds, we anticipate a breakout above the triangle, which could ignite strong bullish momentum. The e

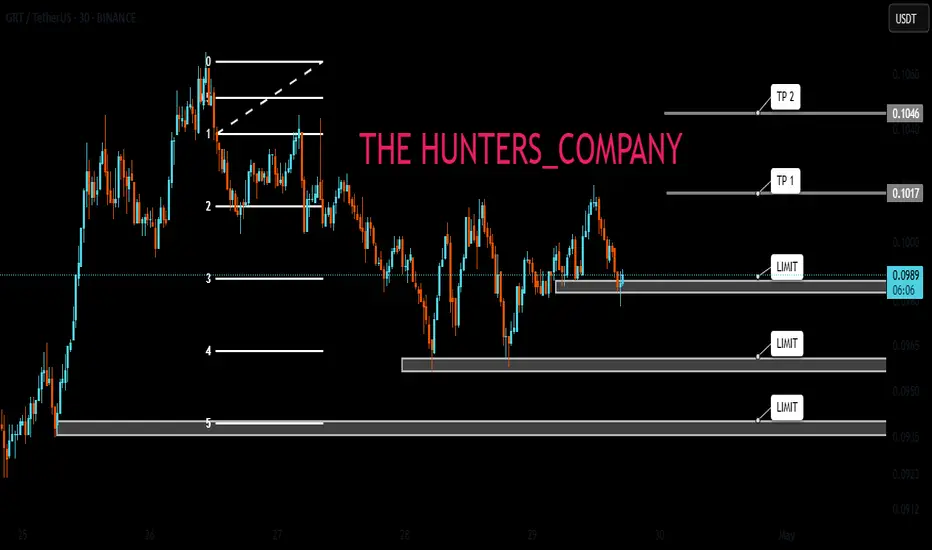
Is it time to buy?Hello friends✌
Given the good price growth and the arrival of buyers, now that the price is correcting, it is the best time to buy.
🙏If you like it, support it with a ✔like✔ and ✔comment✔.
*Trade safely with us*
GRTUSDT 1D AnalysisGRT ~ 1D Analysis
#GRT Buy when re -testing this support block or buy after successfully penetrating this resistant line with a short -term target of at least 10%+.

#GRT/USDT#GRT
The price is moving within a descending channel on the 1-hour frame, adhering well to it, and is on its way to breaking it strongly upwards and retesting it.
We are seeing a bounce from the lower boundary of the descending channel, which is support at 0.0956.
We have a downtrend on the RSI in

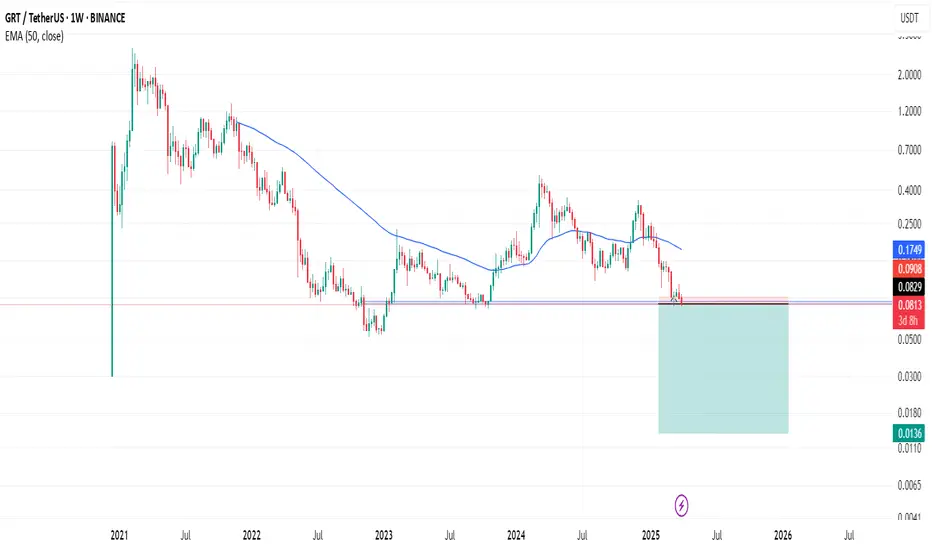
The Graph: Your Altcoin ChoiceCan The Graph really grow by 6,000% in 2025?
I don't know, seems like a lot but I also have some more conservative targets.
$2.04 can yield a huge 2,493% from current levels. This is GRTUSDT moving up and not hitting a new All-Time High in 2025. There is a long long-term higher low and higher lows

The Graph drop to 0.055C Then Rally to 0.27C?Hello traders as we can see the graph looks like it may be falling and testing the ultimate lows what I have named the last line of defence which is around 0.05C. Great buying opportunity where I will be loading my bags. From here an obvious take profit is that prevailing green trend line suppressin


THE GRAPH LOWER BEFORE HIGHER?Hello traders as we can see the graph is trying to break out but is struggling. I believe a ST of that yearly low 0.0796 is about to take place. Before pushing higher the graph needs liquidity from lower prices If broken cheaper prices are on the horizon such as
0.0765
0.0732
0.6
and even 0.0520 C

bearish market GRT is showing readiness to touch lower prices. I suggest standing by for long positions in autumn.
GRAPH MAKE IT OR BREAK ITHello traders as we can see the GRAPH is in a continuous downtrend. I believe it will come and test the yearly low or even put in a new low

See all ideas
Summarizing what the indicators are suggesting.
Oscillators
Neutral
SellBuy
Strong sellStrong buy
Strong sellSellNeutralBuyStrong buy
Oscillators
Neutral
SellBuy
Strong sellStrong buy
Strong sellSellNeutralBuyStrong buy
Summary
Neutral
SellBuy
Strong sellStrong buy
Strong sellSellNeutralBuyStrong buy
Summary
Neutral
SellBuy
Strong sellStrong buy
Strong sellSellNeutralBuyStrong buy
Summary
Neutral
SellBuy
Strong sellStrong buy
Strong sellSellNeutralBuyStrong buy
Moving Averages
Neutral
SellBuy
Strong sellStrong buy
Strong sellSellNeutralBuyStrong buy
Moving Averages
Neutral
SellBuy
Strong sellStrong buy
Strong sellSellNeutralBuyStrong buy
Displays a symbol's price movements over previous years to identify recurring trends.