GRT - PRICE ANALYSIS#GRT - Price Analysis: 🟥
I've been here through many bull market phases over the years, and I feel sad for holders seeing such a big project trading under levels from years ago, before the run...🥶
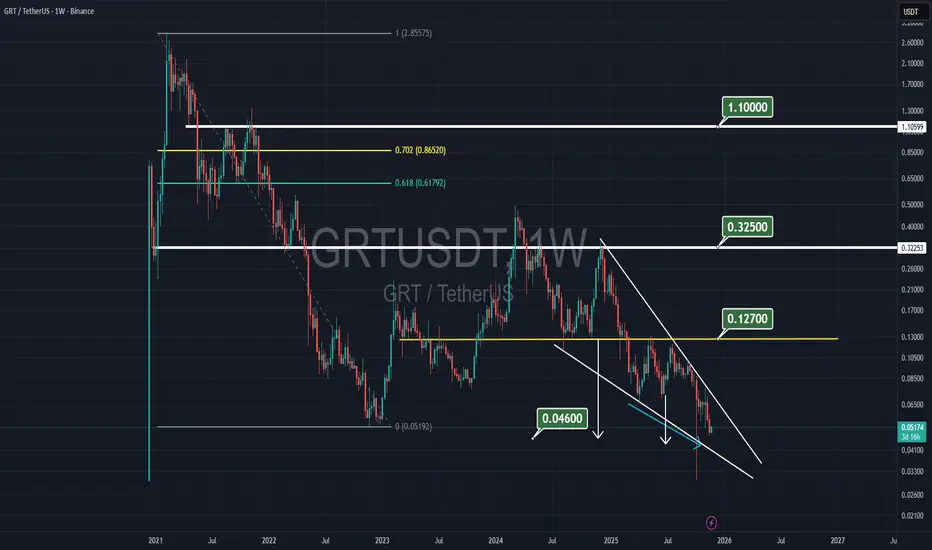
Current chart looks pretty bearish, reflecting the lack of demand & users in the market. 📉
Technical outlook:
I don't see any historical support here except point 0 (LL) around $ 0.0300.
Same as and many others:
under red zone & downtrend, seeing another wave of dump looks more realistic 📉
Other key levels are marked on my chart. I'm staying transparent with what I'm seeing here. 🥵
DYOR before investing.
Market insights

TradeCityPro | GRT Testing Key Support in Wide Range Structure👋 Welcome to TradeCity Pro!
In this analysis I want to review the GRT coin for you. One of the DeFi and Solana ecosystem projects that with a market cap of 481 million dollars is ranked 95 on CoinMarketCap.
⏳ 1-hour timeframe
In the 1-hour timeframe, a range box has formed between the zones 0.04491 and 0.4693, and the price has been fluctuating between these two zones for several days.
💥 The zone 0.04491 is a very important support for this coin, and breaking it or being supported from it can start the next movement wave on GRT.
🎯 Since in the higher timeframes like daily and weekly its trend is bearish, then with the break of 0.04491 this trend can continue and we can open a short position with it.
⚡️ If the price is supported from this zone and moves toward the 0.4693 top, we can open a long position by breaking 0.4693.
⚖️ This trigger is the first trigger for a long and is considered a risky trigger. I prefer to wait to get more confirmations for this coin turning bullish.
📊 For now, the main trigger for GRT to turn bullish will be the break of its main resistance at 0.05014.
❌ Disclaimer ❌
Trading futures is highly risky and dangerous. If you're not an expert, these triggers may not be suitable for you. You should first learn risk and capital management. You can also use the educational content from this channel.
Finally, these triggers reflect my personal opinions on price action, and the market may move completely against this analysis. So, do your own research before opening any position.

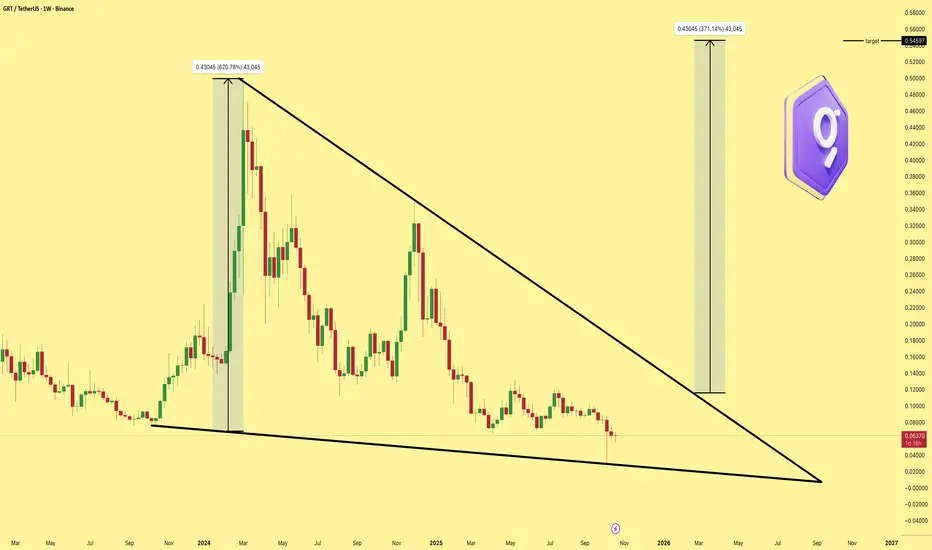
GRT coin to RISE againGRT very likely find a bottom in this area and start to rally very soon after breaking the long-term falling wedge to about $0.33
GRT USDT Hello everyone,
After many years, I’m back with a fresh analysis of The Graph (GRT).
This setup caught my attention, so I wanted to share my thoughts with you.
On the weekly timeframe, I see a strong support level around 0.054.
As long as the weekly candle does not close below this level, I expect a bullish move from GRT.
The Graph is a highly important project for the Ethereum ecosystem, and in my opinion, Ethereum relies heavily on The Graph.
At these price levels, the chart looks attractive, and with a calculated risk-to-reward ratio, it could offer a solid opportunity.
This is not financial advice; everyone is responsible for their own risk.

GRTGETTEX:GRT is showing clear signs of a confirmed bottom and is starting to form a healthy uptrend. With its strong fundamentals and reputation as the “Google of blockchain,” I believe it can easily reach between $2 and $3 in the next major cycle.

THE GRAPH. USDT ( GRT )The Graph on the weekly time frame shows points that multiply the attractiveness of this currency.
Considering the holding of 229 million Graph tokens, and the total supply of tokens of this currency, and most importantly, the price that is even trading below the initial offering price.
We can be optimistic that the price of this currency will reach $ 0.15 in the short term.
But its medium-term goals are $ 0.30 and the long-term goal is $ 0.50.
However, with the entry of smart money, the price growth to $ 1 is possible.

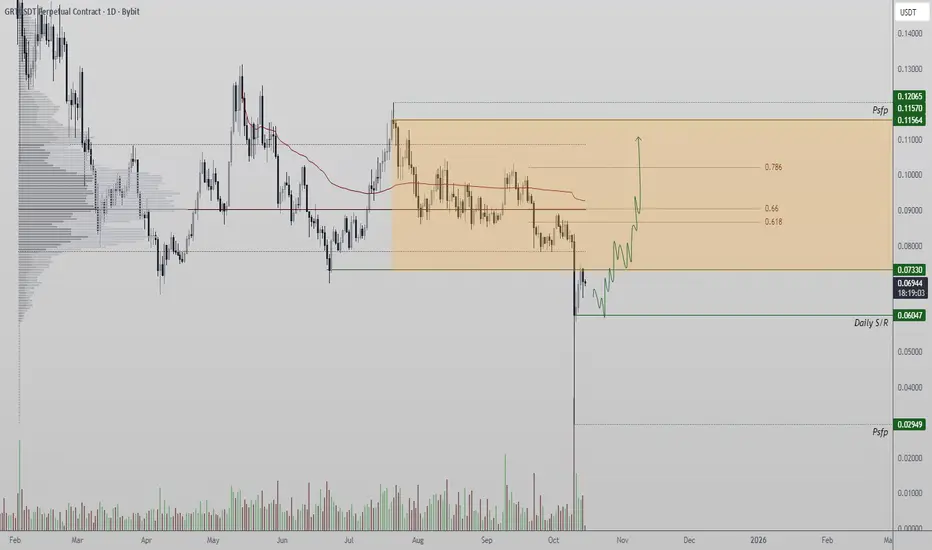
GRTUSDT 1D#GRT is currently trading within a falling wedge pattern on the daily chart. In case of a breakout above the wedge resistance and the daily EMA100, the potential upside targets are:
🎯 $0.08050
🎯 $0.09355
🎯 $0.10410
🎯 $0.11465
🎯 $0.12967
🎯 $0.14880
⚠️ Always remember to use a tight stop-loss and maintain proper risk management.

GRTGETTEX:GRT is displaying a clear V-shaped recovery, signaling a strong reversal from recent lows. The structure suggests the bottom is likely established, with momentum shifting upward as buying pressure and market sentiment continue to strengthen.

GRTGETTEX:GRT looks ready for a breakout within the next 300 days, showing a strong setup with a projected 750% short-term gain from current levels. On top of that, there’s major news expected by the end of the month that could act as a catalyst for momentum. They’re consistently building and releasing new tech that strengthens the ecosystem, setting GETTEX:GRT up for a strong uptrend once the news drops.
GRTGETTEX:GRT has formed a clean descending wedge pattern with the first short-term target already in sight. A major breakout looks imminent. Now’s a great time to accumulate altcoins, GETTEX:GRT , the Google of blockchains, remains one of the strongest utility plays.

GRTGETTEX:GRT has returned to its open trading price and is sitting on a major support level, which has historically been a strong accumulation zone. I’m expecting a breakout soon, with two short-term targets likely to be reached within the next 189 days.

GRT/USDT — On the Edge of Collapse or Start of a Major Reversal?GRT is currently sitting at a critical decision zone, a historical support area that has served as a strong price floor since 2022. After a long and exhausting downtrend, the weekly candle has once again reached the key demand zone at $0.0661 – $0.051, with a deep wick extending down to $0.03 — a classic sign of a liquidity sweep that could mark the beginning of a major accumulation phase.
---
🔹 Market Structure and Pattern
On the macro scale, GRT remains in a bearish trend, forming a consistent pattern of lower highs and lower lows since its 2021 peak. However, this phase is now showing early signs of potential bottom formation in the same demand zone that triggered a strong rally back in mid-2023.
The long wick to the downside indicates market capitulation — a point where many traders panic sell, while larger players quietly start accumulating positions. If the weekly candle closes above this yellow zone, the probability of a macro reversal begins to rise.
---
🟢 Bullish Scenario – Rebound from the Depths
Initial confirmation: Weekly close above $0.055 – $0.06.
First upside target: $0.125 (local resistance and weekly pivot).
A break above $0.125 opens the door to the next targets:
$0.18695 → $0.32369 → $0.43378 → $0.52727 → $1.0568
Expected structure: Higher Low + Break of Structure (BoS) on the weekly timeframe.
Strong momentum in this zone could signal the beginning of a re-accumulation phase before the next bullish cycle.
---
🔴 Bearish Scenario – If the Support Gives Way
If the weekly close falls below $0.051, GRT could enter another phase of distribution.
A failed retest at $0.0661 would strengthen the bearish signal, targeting $0.03 or lower.
The structure remains bearish until a valid higher high forms on the weekly timeframe.
This could also represent the final capitulation leg before a true long-term reversal begins.
---
⚖️ Conclusion
GRT is currently positioned at a decisive crossroads — will this become “the final dip before reversal,” or the continuation of pain?
The reaction within this zone will determine the macro structure for 2025.
As long as the $0.0661–$0.051 area holds, a rebound remains highly possible.
However, a weekly close below this zone will confirm a deeper bearish continuation and delay recovery for a longer period.
---
#GRTUSDT #GRT #TheGraph #CryptoTA #PriceAction #SupportResistance #ReversalZone #CryptoTrading #MarketStructure #SwingTrade #CryptoChart

GRT Testing Key Daily Support for Potential ReversalGRT has lost its prior structural support at $0.020, retracing into a lower range where daily support has formed at $0.006. This region now serves as the key demand zone for potential structural recovery.
Key Technical Points:
- Previous Support Lost: $0.020
- Current Support: $0.006
- Bias: Reversal potential forming
After the breakdown, buyers have begun absorbing liquidity at the base, indicating accumulation at lower levels. A bullish retest around $0.006 could confirm the formation of a double-bottom structure, which often precedes a short-term trend reversal.
Holding this base may allow price to reclaim higher levels, targeting the $0.010–$0.012 range. Conversely, failure to defend support could lead to extended downside.
Overall, GRT remains in early accumulation, with $0.006 serving as the make-or-break level for bullish continuation.
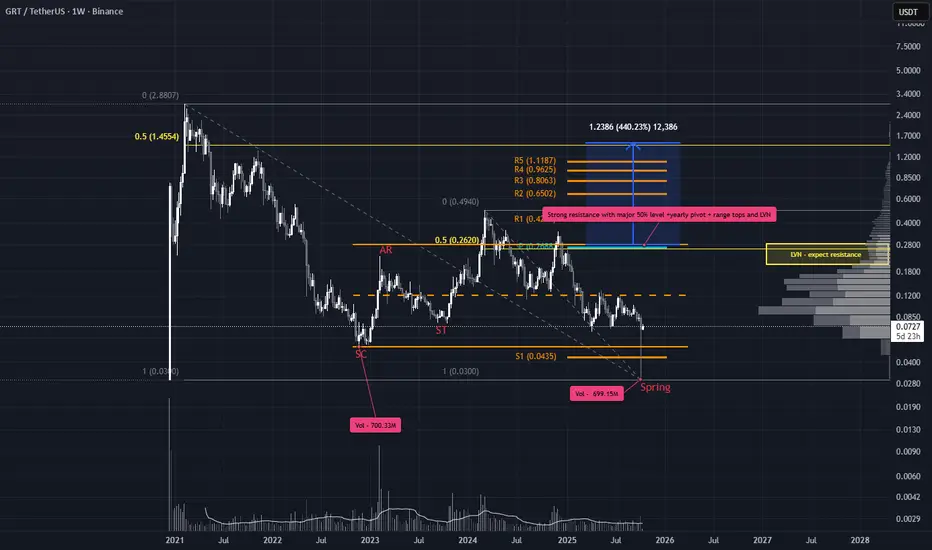
Spring in Play, Structure SpeaksGRT is showing a fantastic range structure with a clean spring—an ideal case study in Wyckoff volume analysis.
Despite the historic $20B crypto liquidation on October 10th, GRT’s wick printed on lower volume than the Selling Climax (SC), suggesting no need for a Spring retest. Price closed decisively back inside the range and above the yearly S1 pivot classic signs of smart money absorption.
Trade Scenarios
Option 1: Immediate Entry
Entry: Current price
Stop Loss: Just below the Spring
Targets:
TP1: ~$0.26 — strong resistance zone
TP2: ~$1.53 — projected range target aligned with macro 50% level
These targets may seem ambitious, but they’re structurally derived. This is what the chart is telling us.
Option 2: Pullback Entry
Entry: Wait for a pullback near the EQ of the Spring wick on the daily TF
Stop Loss: Based on daily structure
Targets: Same as Option 1
#GRTUSDT Daily ChartPrice did a liquidity sweep after breaking below the support line and is currently moving up again. MACD is showing some bearish weakness, RSI is sold and EMAs are bearish. Price is expected to reach the 12h supply at $0.08 as a short-term target before potentially moving down again.

The Graph. USDT The Graph ( GRT ) has the lowest risk among other currencies by offering all tokens.
The total number of Graph tokens is 10 billion and 800 million, all of which were offered to the market.
Therefore, with the recent drop, this is the best point to buy this currency.
Every price drop is an opportunity to enter this currency.
The first target is 10 cents and the actual target is $0.35.
I bought this currency.
Analysis from me, the decision is yours.

GRT liquidation hunt In my opinion, this horrific liquidation event in the crypto market was nothing more than an intense shakeout. I believe that we will begin to see an epic reversal across the board over the next month or two. The path is finally clearing up for a true altseason to kick off.
Here is a visual representation of what I believe the GETTEX:GRT chart will end up looking like soon as an example of what I see coming for the vast majority of the altcoin market.
Take it easy traders and stay cautious
Kieza tradez

GRTUSDT: Trend in daily time frameThe color levels are very accurate levels of support and resistance in different time frames, and we have to wait for their reaction in these areas.
So, Please pay special attention to the very accurate trend, colored levels, and you must know that SETUP is very sensitive.
Be careful
BEST
MT

THE GRAPH. USDT ( GRT )If you bought it before, now is not the time to sell.
Hold at least until $0.12 or $0.13.
The goals for this token are up to 5 times the current price.
The project is very strong and has almost reached its bottom price.
This coin is growing well with the first support
If you are planning to buy,
points
$0.08
$0.079
$0.078
could be good entry points.

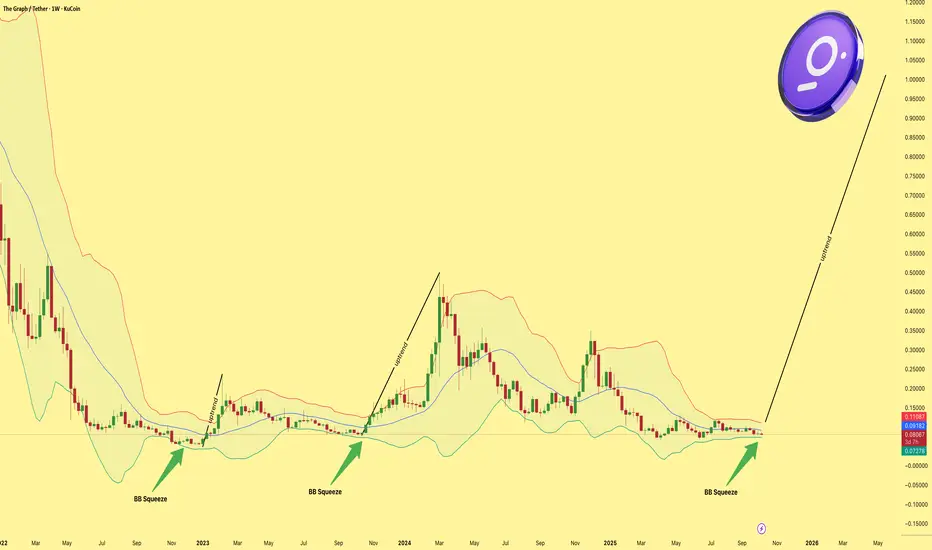
GRT (Google of Blockchains) GETTEX:GRT Bollinger Bands are squeezing tighter than ever. Historically, every setup like this led to a strong upside move. After 217 days of sideways action, a breakout looks imminent. Short-term target sits at $1 once volatility expands.
GRT 10x$8 is a very strong price. This time IA will take the money as metaverse did last 4 year cycle.

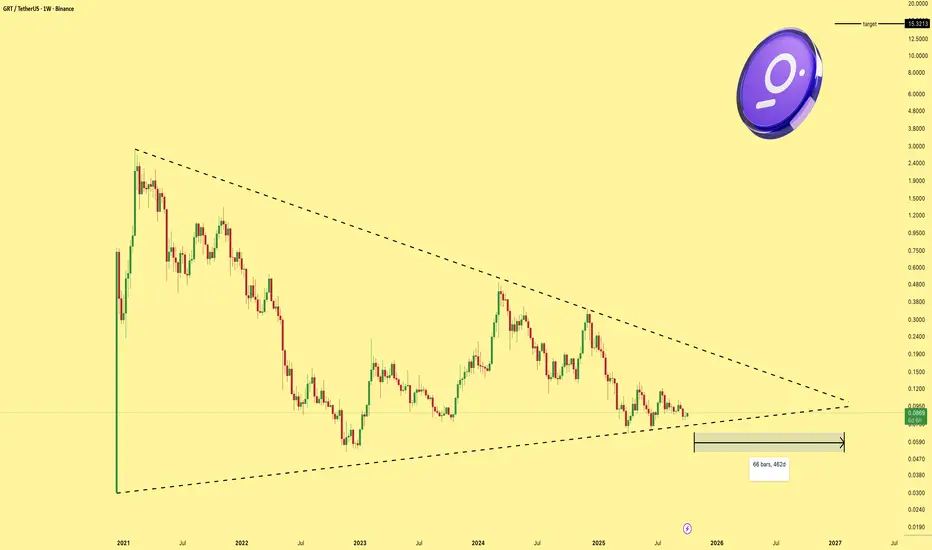
GRT/USDTGETTEX:GRT — often dubbed the Google of blockchain — is a multi-chain AI infrastructure project showing clear signs of price compression within a symmetrical triangle. With listings on Coinbase, Binance, and other major exchanges, liquidity is strong. A breakout looks imminent, and GETTEX:GRT is positioned to outperform in the next expansion phase.
GRT/USDT — Accumulation Zone or Bearish Continuation?GRT/USDT is once again retesting the historical support zone (0.047–0.095), an area that has acted as a major demand level since 2022. This zone can be considered the “final wall” before a potential continuation of the long-term downtrend — or the foundation for a multi-year accumulation base.
The long-term structure still shows a series of lower highs since the 2021 peak, reflecting strong selling pressure. However, the fact that this yellow zone has held for nearly 3 years signals possible institutional demand or smart retail accumulation.
If this zone holds, the probability of a major reversal increases, especially if supported by strong weekly volume.
---
📈 Bullish Scenario
1. Rebound from accumulation zone: If price holds above 0.082 and forms a strong reversal candle (hammer / bullish engulfing), the first target is 0.1281.
2. Confirmed breakout: A weekly close above 0.1281 would shift structure bullish, opening upside targets at 0.1868 → 0.2402 → 0.3233.
3. Extended rally: If the broader crypto market supports, the price could extend toward 0.4352 – 0.5285, with long-term potential toward 1.0982.
---
📉 Bearish Scenario
1. Support breakdown: A weekly close below 0.047 would invalidate the accumulation zone, confirming further downside.
2. Bearish continuation: Next liquidity levels may lie around 0.03 – 0.02 or potentially new lows.
3. High selling volume: If breakdown occurs with strong bearish volume, chances of a quick recovery diminish significantly.
---
📊 Technical Pattern
Accumulation zone (yellow box): Major demand area since 2022.
Range-bound movement: Trading between 0.047 (bottom) and 0.128 (top).
Lower highs: Sellers remain in control, yet buyers repeatedly step in around 0.05–0.08.
Potential large double/triple bottom: If support holds, this could form a strong long-term reversal structure.
---
🎯 Trading Plan & Risk Management
Aggressive setup (risk-takers): Buy within 0.055–0.082 with a stop below 0.047. First target 0.1281 (R:R ≈ 1:1.7), extended targets up to 0.2402 (R:R > 5).
Conservative setup (trend-followers): Wait for a weekly breakout above 0.1281 with strong volume confirmation, then aim for 0.1868 – 0.2402.
Risk note: Since the support box is wide, use small position sizing to avoid large drawdowns.
---
📌 Conclusion
GRT is at a multi-year critical level. The 0.047–0.095 zone is decisive for long-term direction:
If it holds → strong chance of a major reversal and accumulation base.
If it breaks down → high probability of deeper continuation of the bearish trend.
Swing traders may look for bounces within the range, while long-term investors should closely monitor weekly closes and volume before committing.
---
#GRT #GRTUSDT #TheGraph #CryptoAnalysis #CryptoTrading #SupportResistance #AltcoinAnalysis #CryptoSwing #TechnicalAnalysis
