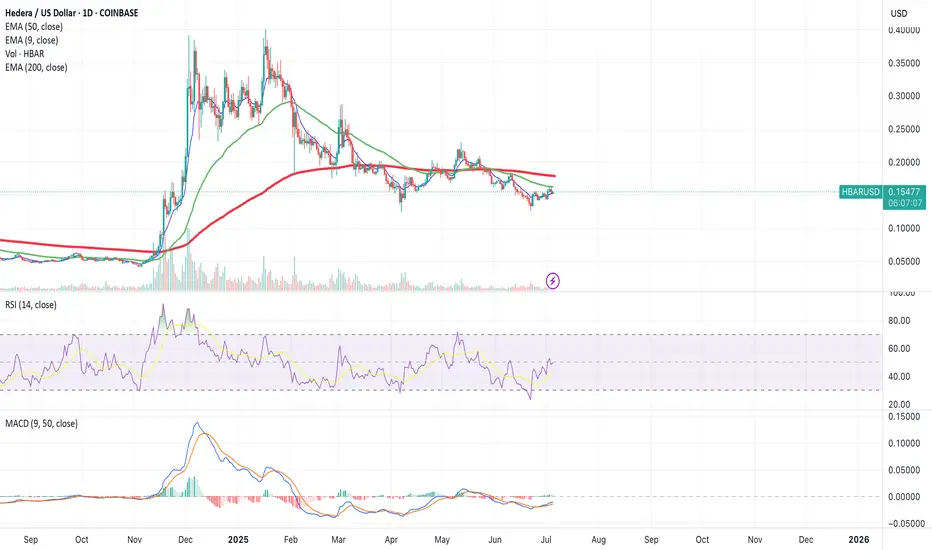
HBAR ChartHi there,
Any insights on the chart please. I believe that because its still below 50 MA, should wait on an entry.
Key stats
About Hedera Hashgraph
Related coins
HBAR to $1.00If price breaks between the 50%-61.8% retracement I'm looking for a long position to $1.00.

I have been waiting to get my signal on HBAR and finally got it!Trading Fam,
I know my crypto portfolio is getting destroyed as I prepare for a future altcoin run towards the latter half of this year. And it sucks. Bitcoin hodl'ers definitely look like the true champions at this point outpacing us altcoin traders by a huge margin. However, I've been through thi

HBARUSD: Final rally starting.Hedera is repeating the peak formation of the previous Cycle. Being bearish, almost oversold on its 1D technical outlook (RSI = 35.527, MACD = -0.005, ADX = 29.745) while being supported by its 1W MA50, makes it a buy opportunity again. We turn bullish, targeting the R1 level (TP = 0.39000).
## I

Monitoring a possible leading diagonal move on Hedera HBARAs you can see in Fig. A, HBAR has often printed some nice, recognisable diagonal patterns (in this case, A was a leading diagonal for a nice 5-count rally).
I believe we have another such diagonal forming now at Fig. B
It's clear that this is a slightly smaller pattern, suggesting a degree lo

Hedera Stock Chart Fibonacci Analysis 060125
Trading Idea
1) Find a FIBO slingshot
2) Check FIBO 61.80% level
3) Entry Point > 0.167/61.80%
Chart time frame:B
A) 15 min(1W-3M)
B) 1 hr(3M-6M)
C) 4 hr(6M-1year)
D) 1 day(1-3years)
Stock progress:A
A) Keep rising over 61.80% resistance
B) 61.80% resistance
C) 61.80% support
D) Hit the bottom

HBAR (Local) Elliot Wave ii UnderwayHBAR appears to have completed a leading diagonal for wave 1 after finding a bottom at the major support high volume node (HVN).
Wave 2 has retraced the expected 61.8% Fibonacci but alt coins have their own Golden Pocket at the 78.6% retracement which aligns with the S1 pivot and high volume node.

HBAR Will Make a Nice Run After May 26thHBAR will be one of the cryptocurrencies that will rip the hardest this cycle.
Currently HBAR is going to sweep a liquidation wick at around .16-.17 (Should be hit before May 26th)
from there on, HBAR should have a 5 week consecutive rally to above $1.8 until the end of June to beginning of July.


HBAR RAB-H Rabbi Hedera gave you the money tomorrow and then the other one and I can do the money to the other one and then I got the money tomorrow morning and I will send it out to me today

See all ideas
Summarizing what the indicators are suggesting.
Oscillators
Neutral
SellBuy
Strong sellStrong buy
Strong sellSellNeutralBuyStrong buy
Oscillators
Neutral
SellBuy
Strong sellStrong buy
Strong sellSellNeutralBuyStrong buy
Summary
Neutral
SellBuy
Strong sellStrong buy
Strong sellSellNeutralBuyStrong buy
Summary
Neutral
SellBuy
Strong sellStrong buy
Strong sellSellNeutralBuyStrong buy
Summary
Neutral
SellBuy
Strong sellStrong buy
Strong sellSellNeutralBuyStrong buy
Moving Averages
Neutral
SellBuy
Strong sellStrong buy
Strong sellSellNeutralBuyStrong buy
Moving Averages
Neutral
SellBuy
Strong sellStrong buy
Strong sellSellNeutralBuyStrong buy
Displays a symbol's price movements over previous years to identify recurring trends.
Curated watchlists where HBARUSD is featured.

Eco-friendly crypto tokens: Green cryptocurrencies
14 No. of Symbols

Top altcoins: Choose your alternatives carefully
28 No. of Symbols
See all sparks
Frequently Asked Questions
The current price of Hedera Hashgraph (HBAR) is 0.15940166 USD — it has fallen −0.06% in the past 24 hours. Try placing this info into the context by checking out what coins are also gaining and losing at the moment and seeing HBAR price chart.
The current market capitalization of Hedera Hashgraph (HBAR) is 6.76 B USD. To see this number in a context check out our list of crypto coins ranked by their market caps or see crypto market cap charts.
Hedera Hashgraph (HBAR) trading volume in 24 hours is 122.43 M USD. See how often other coins are traded in this list.
Hedera Hashgraph price has risen by 3.73% over the last week, its month performance shows a −3.66% decrease, and as for the last year, Hedera Hashgraph has increased by 136.42%. See more dynamics on HBAR price chart.
Keep track of coins' changes with our Crypto Coins Heatmap.
Keep track of coins' changes with our Crypto Coins Heatmap.
Hedera Hashgraph (HBAR) reached its highest price on Sep 16, 2021 — it amounted to 0.58391228 USD. Find more insights on the HBAR price chart.
See the list of crypto gainers and choose what best fits your strategy.
See the list of crypto gainers and choose what best fits your strategy.
Hedera Hashgraph (HBAR) reached the lowest price of 0.00932203 USD on Jan 14, 2020. View more Hedera Hashgraph dynamics on the price chart.
See the list of crypto losers to find unexpected opportunities.
See the list of crypto losers to find unexpected opportunities.
The current circulating supply of Hedera Hashgraph (HBAR) is 50.00 B USD. To get a wider picture you can check out our list of coins with the highest circulating supply, as well as the ones with the lowest number of tokens in circulation.
Hedera Hashgraph has the limit of 50.00 B coins. No matter how the currency evolves, no new coins will be released after this number is reached.
The safest choice when buying HBAR is to go to a well-known crypto exchange. Some of the popular names are Binance, Coinbase, Kraken. But you'll have to find a reliable broker and create an account first. You can trade HBAR right from TradingView charts — just choose a broker and connect to your account.
Crypto markets are famous for their volatility, so one should study all the available stats before adding crypto assets to their portfolio. Very often it's technical analysis that comes in handy. We prepared technical ratings for Hedera Hashgraph (HBAR): today its technical analysis shows the buy signal, and according to the 1 week rating HBAR shows the sell signal. And you'd better dig deeper and study 1 month rating too — it's buy. Find inspiration in Hedera Hashgraph trading ideas and keep track of what's moving crypto markets with our crypto news feed.
Hedera Hashgraph (HBAR) is just as reliable as any other crypto asset — this corner of the world market is highly volatile. Today, for instance, Hedera Hashgraph is estimated as 6.56% volatile. The only thing it means is that you must prepare and examine all available information before making a decision. And if you're not sure about Hedera Hashgraph, you can find more inspiration in our curated watchlists.
You can discuss Hedera Hashgraph (HBAR) with other users in our public chats, Minds or in the comments to Ideas.