Hedera (HBAR): Looking For Breakdown + Fill of Bearish CMEHBAR has recently broken the branch of EMAs, which have been holding the bullish trend for a while.
Now that we have broken the branch of EMAs, we are expecting to see the sellers keep control over that zone, which would lead the price towards the bearish CME gap; filling it would be a good bullis
Related pairs

HBAR/USDT – Gearing Up for a Major Bullish Wave!🚀 Trade Setup Details:
🕯 #HBAR/USDT 🔼 Buy | Long 🔼
⌛️ TimeFrame: 1D
--------------------
🛡 Risk Management (Example):
🛡 Based on $10,000 Balance
🛡 Loss-Limit: 1% (Conservative)
🛡 The Signal Margin: $374.39
--------------------
☄️ En1: 0.19607 (Amount: $37.44)
☄️ En2: 0.17665 (Amount: $131.04)
☄️ E

HBAR’s ABC Setup — Short-Term Pain, Long-Term Gain?HBAR has been consolidating sideways for the past 30 days, with $0.27 acting as a clear resistance — aligning with the golden pocket (GP). Price failed to sustain above the yearly open (yOpen) at $0.26901, despite multiple attempts. Each breakout attempt lacked follow-through → weakness.
Structural

HBAR Bull Flag Is Ready to Explode, But Only If One Level FallsYello, Paradisers! Is #HBAR quietly setting up for its biggest breakout of the year? The chart is heating up fast, and the next move will be decisive.
💎Since forming a double bottom around $0.128, HBAR has bounced sharply, showing clear strength. The price action is now shaping into a potential bul

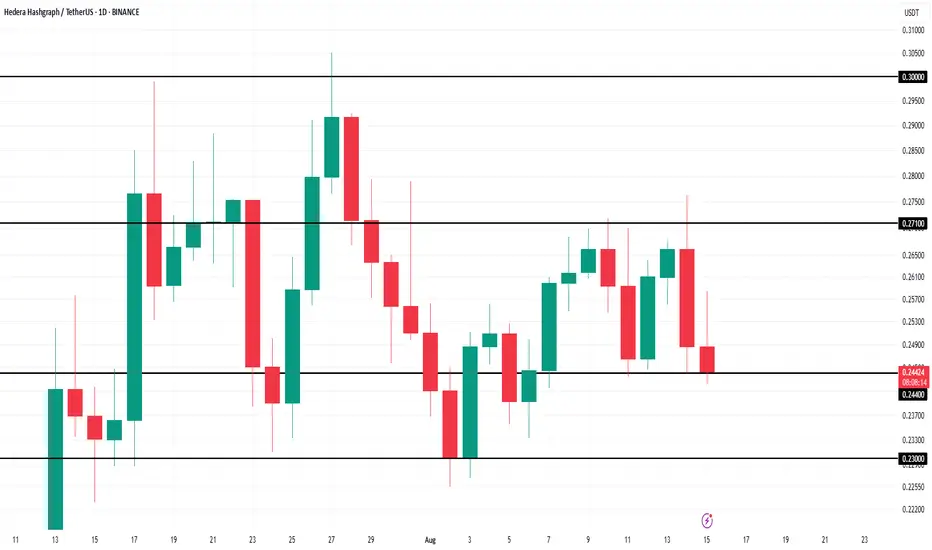
HBARUSDT — Retest of Demand Zone After Breakout?HBAR/USDT is currently in a crucial retest phase after a strong breakout from its key accumulation zone around 0.199–0.217 (yellow box, Fib 0.5–0.618 area). The recent rally toward 0.29–0.30 highlighted strong buying momentum, but price is now consolidating near 0.243, suggesting a healthy pullback

HEDERAHBAR/USDT Chart Analysis
HBAR/USDt Timeframe Daily
1. Trend and Pattern Identification
The chart shows a strong uptrend from early July to mid-August. After reaching a peak around the $0.30 price level, the price entered a sideways movement (consolidation). The current price action indicates that

HBAR about to make new ATHsHBAR is currently c. 0.27% of the total crypto market. I expect this to go up higher as HBAR.D could potentially hit 0.65% and 1%. HBAR should now be considered an OG crypto especially when it made an ATH in the previous cycle, and also likely to make another new ATH in the 24/25 cycle. Not all alt

Habar short to $0.22912Just now opened another position on hbar. Close a while ago but seems liked a fakeout.
Sl: 0.23678
tp: 0.22912
Roughly 2 rr

HL Ladder + Sweep = Long Setup LoadedHolding higher lows, sweeping local liquidity, and prepping for a 0.305–0.322 extension. The HBAR ladder keeps climbing.
📊 BYBIT:HBARUSDT.P — Liquidity-Grab Pullback
🎯 Direction: Long (only after downside sweep confirmed)
📍 Entry Zone: 0.263 – 0.271 (refined bullish OB / 0.50–0.618 retrace of BO

HBAR Price Stalls as Outflows Hit 2-Month High—What’s Next?BINANCE:HBARUSDT price is currently at $0.243 , trapped within the range of $0.244 to $0.271. The mixed market cues, including the bearish CMF and the relatively neutral RSI, suggest that HBAR could continue consolidating.
This sideways movement is expected to persist unless there is a major shi
See all ideas
Summarizing what the indicators are suggesting.
Oscillators
Neutral
SellBuy
Strong sellStrong buy
Strong sellSellNeutralBuyStrong buy
Oscillators
Neutral
SellBuy
Strong sellStrong buy
Strong sellSellNeutralBuyStrong buy
Summary
Neutral
SellBuy
Strong sellStrong buy
Strong sellSellNeutralBuyStrong buy
Summary
Neutral
SellBuy
Strong sellStrong buy
Strong sellSellNeutralBuyStrong buy
Summary
Neutral
SellBuy
Strong sellStrong buy
Strong sellSellNeutralBuyStrong buy
Moving Averages
Neutral
SellBuy
Strong sellStrong buy
Strong sellSellNeutralBuyStrong buy
Moving Averages
Neutral
SellBuy
Strong sellStrong buy
Strong sellSellNeutralBuyStrong buy
Displays a symbol's price movements over previous years to identify recurring trends.
Frequently Asked Questions
The current price of Hedera Hashgraph / TetherUS (HBAR) is 0.24701 USDT — it has fallen −1.64% in the past 24 hours. Try placing this info into the context by checking out what coins are also gaining and losing at the moment and seeing HBAR price chart.
Hedera Hashgraph / TetherUS price has fallen by −1.22% over the last week, its month performance shows a 4.23% increase, and as for the last year, Hedera Hashgraph / TetherUS has increased by 315.14%. See more dynamics on HBAR price chart.
Keep track of coins' changes with our Crypto Coins Heatmap.
Keep track of coins' changes with our Crypto Coins Heatmap.
Hedera Hashgraph / TetherUS (HBAR) reached its highest price on Sep 16, 2021 — it amounted to 0.57600 USDT. Find more insights on the HBAR price chart.
See the list of crypto gainers and choose what best fits your strategy.
See the list of crypto gainers and choose what best fits your strategy.
Hedera Hashgraph / TetherUS (HBAR) reached the lowest price of 0.00914 USDT on Dec 31, 2019. View more Hedera Hashgraph / TetherUS dynamics on the price chart.
See the list of crypto losers to find unexpected opportunities.
See the list of crypto losers to find unexpected opportunities.
The safest choice when buying HBAR is to go to a well-known crypto exchange. Some of the popular names are Binance, Coinbase, Kraken. But you'll have to find a reliable broker and create an account first. You can trade HBAR right from TradingView charts — just choose a broker and connect to your account.
Crypto markets are famous for their volatility, so one should study all the available stats before adding crypto assets to their portfolio. Very often it's technical analysis that comes in handy. We prepared technical ratings for Hedera Hashgraph / TetherUS (HBAR): today its technical analysis shows the neutral signal, and according to the 1 week rating HBAR shows the strong buy signal. And you'd better dig deeper and study 1 month rating too — it's strong buy. Find inspiration in Hedera Hashgraph / TetherUS trading ideas and keep track of what's moving crypto markets with our crypto news feed.
Hedera Hashgraph / TetherUS (HBAR) is just as reliable as any other crypto asset — this corner of the world market is highly volatile. Today, for instance, Hedera Hashgraph / TetherUS is estimated as 4.43% volatile. The only thing it means is that you must prepare and examine all available information before making a decision. And if you're not sure about Hedera Hashgraph / TetherUS, you can find more inspiration in our curated watchlists.
You can discuss Hedera Hashgraph / TetherUS (HBAR) with other users in our public chats, Minds or in the comments to Ideas.