Hedera (HBAR): Looking For Breakdown + Fill of Bearish CMEHBAR has recently broken the branch of EMAs, which have been holding the bullish trend for a while.
Now that we have broken the branch of EMAs, we are expecting to see the sellers keep control over that zone, which would lead the price towards the bearish CME gap; filling it would be a good bullish sign, so that's what we are aiming for right now!
Swallow Academy
HBARUSDT trade ideas

HBAR/USDT – Gearing Up for a Major Bullish Wave!🚀 Trade Setup Details:
🕯 #HBAR/USDT 🔼 Buy | Long 🔼
⌛️ TimeFrame: 1D
--------------------
🛡 Risk Management (Example):
🛡 Based on $10,000 Balance
🛡 Loss-Limit: 1% (Conservative)
🛡 The Signal Margin: $374.39
--------------------
☄️ En1: 0.19607 (Amount: $37.44)
☄️ En2: 0.17665 (Amount: $131.04)
☄️ En3: 0.16401 (Amount: $168.48)
☄️ En4: 0.15228 (Amount: $37.44)
--------------------
☄️ If All Entries Are Activated, Then:
☄️ Average.En: 0.17047 ($374.39)
--------------------
☑️ TP1: 0.25245 (+48.09%) (RR:1.8)
☑️ TP2: 0.305 (+78.92%) (RR:2.95)
☑️ TP3: 0.38787 (+127.53%) (RR:4.77)
☑️ TP4: 0.5266 (+208.91%) (RR:7.82)
☑️ TP5: 0.73806 (+332.96%) (RR:12.47)
☑️ TP6: Open 🔝
--------------------
❌ SL: 0.12493 (-26.71%) (-$100)
--------------------
💯 Maximum.Lev: 2X
⌛️ Trading Type: Swing Trading
‼️ Signal Risk: 🙂 Low-Risk! 🙂
🔎 Technical Analysis Breakdown:
This technical analysis is based on Price Action, Elliott waves, SMC (Smart Money Concepts), and ICT (Inner Circle Trader) concepts. All entry points, Target Points, and Stop Losses are calculated using professional mathematical formulas. As a result, you can have an optimal trade setup based on great risk management.
📊 Sentiment & Market Context:
Hedera Hashgraph (HBAR) is showing strong bullish potential on the daily timeframe, supported by increasing volume and a solid base formation around key demand zones. With broader altcoin sentiment improving and BTC showing stability, HBAR could be poised for a breakout rally in the coming weeks.
🔍 Fundamental Highlights:
HBAR powers the Hedera network, a next-gen public ledger built on a unique Hashgraph consensus mechanism—faster, more secure, and more scalable than traditional blockchains. With real-world enterprise partnerships (like Google, IBM, and Boeing), Hedera’s ecosystem continues to gain momentum as Web3 adoption expands.
⚠️ Disclaimer:
Trading involves significant risk, and past performance does not guarantee future results. This analysis is for informational purposes only and should not be considered financial advice. Always conduct your research and trade responsibly.
💡 Stay Updated:
Like this technical analysis? Follow me for more in-depth insights, technical setups, and market updates. Let's trade smarter together!

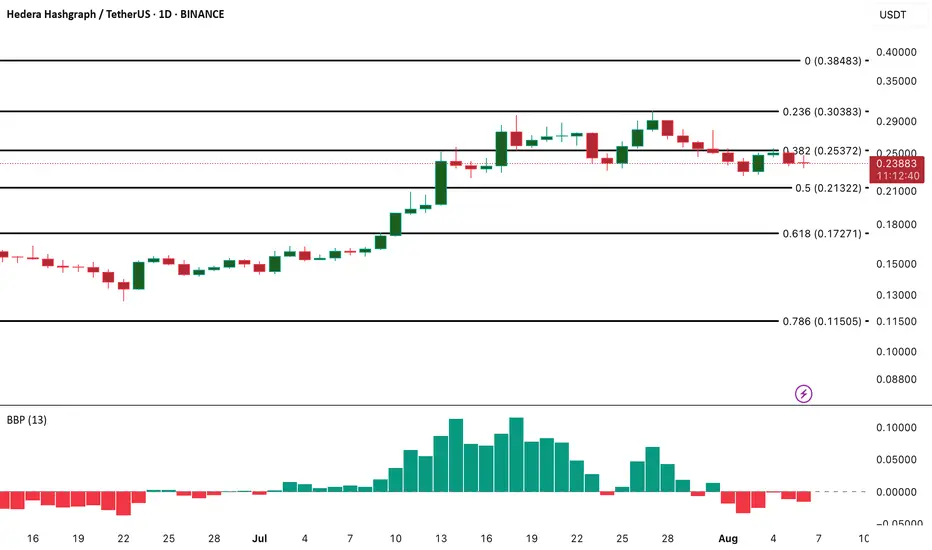
HBAR’s ABC Setup — Short-Term Pain, Long-Term Gain?HBAR has been consolidating sideways for the past 30 days, with $0.27 acting as a clear resistance — aligning with the golden pocket (GP). Price failed to sustain above the yearly open (yOpen) at $0.26901, despite multiple attempts. Each breakout attempt lacked follow-through → weakness.
Structurally, HBAR appears to be in a corrective phase after completing five Elliott waves, and is now potentially forming an ABC corrective pattern. Price has also lost the monthly open (mOpen) at $0.25099, which should now act as resistance.
🔴 Short Opportunity
Previous ideal entry: $0.27463 (Golden Pocket) — offered an R:R of ~1:7
Next short zone: Between mOpen ($0.25099) and yOpen ($0.26901)
Target: Around $0.21/$0.2 as take-profit (TP)
🟢 Long Opportunity Zone
➡️ Primary zone: $0.21 – $0.19675
🧩 Confluence factors:
FVG (Fair Value Gap) / imbalance fill
SSL (Support/Stop-Loss liquidity) positioned in the zone
Weekly level: $0.20685
0.55 Fib retracement: $0.20657 (aligned with the weekly level)
0.75 Fib speed resistance fan: Supports this zone if price reaches it between 19 – 25 Aug
1.0 trend-based Fib extension: $0.19675 (projected Wave C target of ABC)
Pitchfork lower support line intersecting with the zone
nPOC & key level: $0.2
With all these aligning, this is the most favourable long setup.
Long Trade Setup Example
Entry: $0.21– $0.19675
Stop Loss: Below $0.19
TP1: ~$0.223
Final target: $0.3+ (swing trade potential)
R:R: 1:6+
🔍 Indicators used:
DriftLine — Pivot Open Zones → For identifying key yearly/monthly/weekly/daily opens that act as major S/R reference points
➡️ Available for free. You can find them on my profile under “Scripts” and apply them directly to your charts for extra confluence when planning your trades.
_________________________________
💬 If you found this helpful, drop a like and comment!

HBAR about to make new ATHsHBAR is currently c. 0.27% of the total crypto market. I expect this to go up higher as HBAR.D could potentially hit 0.65% and 1%. HBAR should now be considered an OG crypto especially when it made an ATH in the previous cycle, and also likely to make another new ATH in the 24/25 cycle. Not all alt coins have this 'crypto heritage' - with many forming a broader ABC correction in the 20/21 cycle unable to break out to make new ATHs - eg. XRP, XLM, BCH.
With its market cap coin ranking already being higher than the previous cycle (lingering around top 30-50 and now around top 15-20), I am expecting HBAR to find a new ATH. Keep an eye out on the resistance line formed from the previous cycle. If it can break that resistance line, then we can see HBAR hit the next level at $2. HBAR/BTC should also be used to navigate when the top is in.
Key Targets:
1. $0.90~$1.30 (highly probable)
2. ~$2 (moonshot)
3. ~$3.30 (unlikely)
HBAR to the MOON

HEDERAHBAR/USDT Chart Analysis
HBAR/USDt Timeframe Daily
1. Trend and Pattern Identification
The chart shows a strong uptrend from early July to mid-August. After reaching a peak around the $0.30 price level, the price entered a sideways movement (consolidation). The current price action indicates that HBAR is retesting an important support area after its significant rise.
2. Key Support and Resistance Levels
* Main Resistance Level: Located around $0.26012. This is an area where the price struggled to break higher and often faced rejection.
* Key Support Levels: There are two important support areas to note:
* The Nearest Support: Around $0.23638. The current price is slightly below this level.
* Historical Support Area: A strong support zone is highlighted by the blue box, where the price consolidated in May and June. This is a highly relevant area to monitor.
3. Volume Analysis
The chart also shows trading volume. A significant volume spike (indicated by "1.114B D B8") occurred as the price moved up. This high volume suggests strong buying interest at that time. Subsequently, the volume appears to have decreased, which is common during consolidation or price correction phases.
Rationale for Entry Decision
Based on the analysis above, here are a few reasons to consider a long position on HBAR/USDT, while keeping risk management in mind:
Why Is Now a Good Time for Entry?
* Retesting the Support Area: The current HBAR price is near a strong historical support level (the blue box). This is often referred to as a "retest." If this area successfully holds the price from falling further, it could signal a continuation of the uptrend.
* Potential for a Rebound: The price drop from its peak to the support area can be seen as a healthy correction within an uptrend. If there is a price reversal signal (e.g., a bullish candlestick like a hammer or an engulfing pattern) in this area, the chance for a rebound increases.
Things to Watch Out For and Risks
* Confirmation Is Key: Do not enter a position solely because the price is near support. Wait for confirmation of a price reversal signal. This confirmation could be a bullish candlestick pattern or a significant increase in buying volume in the support area.
* Risk of a Support Breakdown: If the HBAR price breaks below the key support level, it could invalidate the bullish scenario and trigger a further decline. Therefore, it is crucial to set a tight stop-loss point, for example, below the historical support area, to limit potential losses.
Summary of Key Events
In summary, the HBAR/USDT chart shows a strong uptrend from July to mid-August, followed by a correction or consolidation phase. The price is currently testing a key support area. The decision to enter a long position should be based on confirmation that this support area will hold and not be breached.

HBAR Bull Flag Is Ready to Explode, But Only If One Level FallsYello, Paradisers! Is #HBAR quietly setting up for its biggest breakout of the year? The chart is heating up fast, and the next move will be decisive.
💎Since forming a double bottom around $0.128, HBAR has bounced sharply, showing clear strength. The price action is now shaping into a potential bullish flag pattern, but the bulls are stuck at a critical barrier.
💎The $0.285–$0.30 zone is proving to be a major challenge, as it combines both horizontal resistance and the 61.8% Fibonacci retracement. Since mid-July, not a single daily candle has been able to close convincingly above this level, a clear sign of just how important this wall is.
💎For #HBARUSDT, a strong breakout and close above $0.30 with real volume would open the doors to a major bullish move, targeting the $0.380–$0.410 zone. This range not only marks the next strong resistance but also aligns with HBAR’s 52-week high.
💎On the downside, solid support lies between $0.235–$0.22, a zone that has held firm since mid-July within a converging triangle formation. As long as HBAR stays above this range, the bullish setup remains valid, and the breakout pressure continues to build.
Paradisers, strive for consistency, not quick profits. Treat the market as a businessman, not as a gambler.
MyCryptoParadise
iFeel the success🌴

Habar short to $0.22912Just now opened another position on hbar. Close a while ago but seems liked a fakeout.
Sl: 0.23678
tp: 0.22912
Roughly 2 rr

HBARUSDT — Retest of Demand Zone After Breakout?HBAR/USDT is currently in a crucial retest phase after a strong breakout from its key accumulation zone around 0.199–0.217 (yellow box, Fib 0.5–0.618 area). The recent rally toward 0.29–0.30 highlighted strong buying momentum, but price is now consolidating near 0.243, suggesting a healthy pullback before the next potential move.
This structure often signals a bullish retest after breakout — but if key support levels are lost, it could trigger a deeper correction.
---
🔍 Structure & Pattern
Previous phase: HBAR traded sideways for months within a large range.
Recent move: Clean breakout above the accumulation zone.
Current phase: Retesting the demand zone.
Pattern in play: Bullish Retest / Flag Consolidation on the daily timeframe.
Bullish continuation trigger: Daily close above 0.29197 with volume confirmation.
Bearish invalidation: Daily close below 0.19928 (Fib 0.618).
---
📌 Key Technical Levels (1D)
Support (Demand Zone):
0.21707 (Fib 0.5) → first line of defense.
0.19928 (Fib 0.618) → strongest support; bullish invalidation if broken.
Resistance Levels:
0.26511 → minor resistance.
0.29197 → major resistance / breakout trigger.
0.33037 → TP1.
0.37526 → TP2.
0.40139 → local high & ultimate mid-term target.
Downside targets (if breakdown):
0.160–0.140 → prior consolidation zone.
0.093–0.087 → historical low.
---
🚀 Bullish Scenarios
1. Conservative (Breakout Buyer):
Entry: Daily close above 0.29197
Stop: Below 0.26511
Targets: 0.33037 / 0.37526
Potential reward: +35% to +54% from current levels
2. Aggressive (Buy the Dip):
Entry: 0.217–0.199 demand zone
Stop: Below 0.199 (bullish invalidation)
Targets: 0.265 / 0.292 / 0.330
Attractive R:R potential (>1:3) if demand holds
---
⚠️ Bearish Scenarios
1. Breakdown of 0.199:
Daily close below 0.199 → structure invalidated.
Downside targets: 0.16 → 0.14, and possibly 0.087 (historical low).
2. Rejection at Resistance:
Failure to break 0.292 + formation of a lower-high = possible range or distribution phase.
Price could revisit 0.217 demand zone again.
---
📈 Strategy & Risk Management
Aggressive traders: Buy dips at 0.217–0.199 with tight stops.
Conservative traders: Wait for confirmation above 0.292 before entering.
Risk management: Limit exposure to 1–2% per trade.
Extra confirmation: Watch for volume spikes or bullish candlestick reversals (hammer, engulfing) in demand zones.
---
✅ Conclusion
HBAR is in a critical demand retest. As long as 0.217–0.199 holds, the bias remains bullish, with mid-term targets at 0.33–0.37. A daily close below 0.199, however, would shift momentum bearish and open the door to a much deeper correction.
HBAR offers a high R:R opportunity for both aggressive dip buyers and conservative breakout traders — making it one of the setups to watch closely in the coming weeks.
#HBAR #HBARUSDT #Hedera #Crypto #TechnicalAnalysis #PriceAction #SwingTrade #Fibonacci

HL Ladder + Sweep = Long Setup LoadedHolding higher lows, sweeping local liquidity, and prepping for a 0.305–0.322 extension. The HBAR ladder keeps climbing.
📊 BYBIT:HBARUSDT.P — Liquidity-Grab Pullback
🎯 Direction: Long (only after downside sweep confirmed)
📍 Entry Zone: 0.263 – 0.271 (refined bullish OB / 0.50–0.618 retrace of BOS leg)
🛑 Stop Loss: 0.255 (below sweep/OB edge; ATR buffer)
💰 Targets:
• TP1 — 0.286
• TP2 — 0.305
• TP3 — 0.322
📐 RR Ratio: ~3.1 : 1 (to TP2)
🧠 Trust Meter: ████████▒▒ — 88%
⸻
🔍 Why We Like It
• HTF Bias (12H/4H): Uptrend intact; HL ladder pressing into prior supply.
• Sweep Trigger: Prefer wick into 0.258–0.262 → close back inside range to take sell-side liquidity.
• LTF Confirmation: After sweep → 15m BOS up (close above last LH) → pullback entry into 0.263–0.271 OB/FVG in fib pocket.
• Participation Filter: Sweep candle vol ≥1.5× 20-bar avg or delta absorption on footprint.
• Macro Context: OI rising, funding tame; BTC.D drifting down supports alt longs.
⸻
📏 Management
• SL → BE+fees at TP1, trail under 5m HL ladder.
• Time-stop: no new HH in 50m → cut 50% or exit.
• Invalidate on 12H close < 0.255 or BTC.D spike intraday.
• Entry must trigger within 6×15m bars after BOS.
⸻
🚀 Candle Craft | Signal. Structure. Execution.

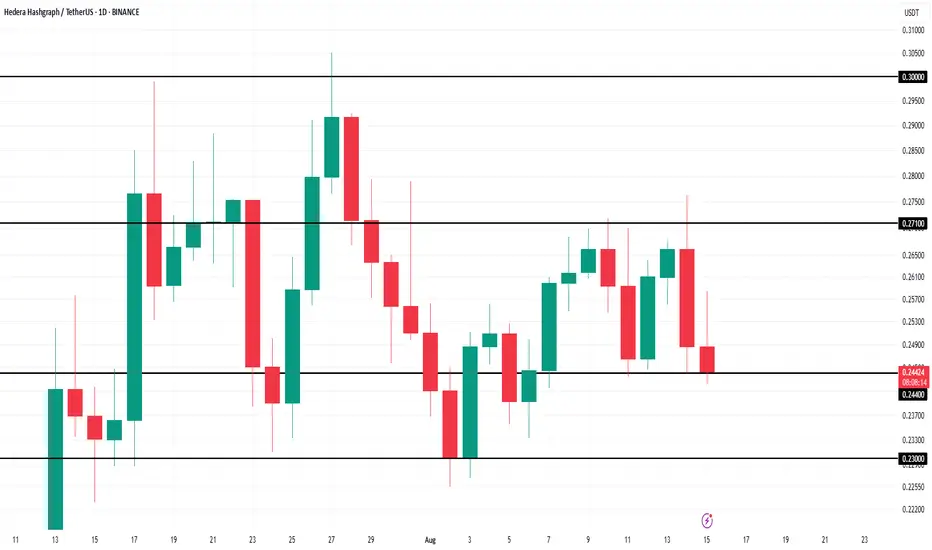
HBAR Price Stalls as Outflows Hit 2-Month High—What’s Next?BINANCE:HBARUSDT price is currently at $0.243 , trapped within the range of $0.244 to $0.271. The mixed market cues, including the bearish CMF and the relatively neutral RSI, suggest that HBAR could continue consolidating.
This sideways movement is expected to persist unless there is a major shift in investor sentiment or a market catalyst that could push the altcoin in either direction.
If outflows intensify and BINANCE:HBARUSDT falls below its $0.244 support level , the bearish case could become more likely. In such a scenario, the price may drop further to $0.230, invalidating the current bullish-neutral outlook and signaling a deeper correction for HBAR.
Hbar is forming a tradable structureBAR is printing many tradable structures on major timeframes. The current one is the possible bull flag with a great RR. Keeping in mind that the daily momentum and trend are still showing negative pressure. Keep your POI hand as the PA unfolds.

HBAR-SYMMETRICAL TRIANGLE BREAKOUTHedera has been consolidating inside a massive symmetrical triangle since late 2023. The structure is clear, with higher lows from November 2023 and lower highs from April 2024. Price is now trading near the apex, suggesting a decisive move is imminent.
🔹 Support Zone: $0.20 – $0.21
🔹 Resistance Zone: $0.25 – $0.27
Bullish Scenario:
A confirmed breakout above $0.27 with strong volume could trigger a major rally. The measured move from the triangle projects targets towards $0.55 – $0.60. Key resistance levels to watch on the way up:
$0.30
$0.35
$0.45
Final target: $0.55+
Bearish Scenario:
If price breaks below $0.20, the triangle setup would fail, with possible pullbacks towards $0.18 → $0.15 → $0.12.

HBAR Eyes Bitcoin for Price Recovery Amid Market UncertaintyBINANCE:HBARUSDT is currently consolidating, trading at $0.255 while oscillating between $0.271 and $0.244 . The narrow range reflects investor caution, with traders awaiting external market cues. Without a decisive breakout, the altcoin may continue drifting sideways in the immediate term.
If Bitcoin strengthens and resumes its rally, BINANCE:HBARUSDT could break resistance at $0.271. Such a move may open the door for gains toward $0.291, with potential upside extending further if bullish conditions persist.
Alternatively, a Bitcoin downturn could drag BINANCE:HBARUSDT lower, pushing it beneath $0.244 support. In such a scenario, the altcoin risks falling to $0.230, undermining the bullish thesis and reinforcing caution among investors.

HBAR Showing Increasing Selling Pressure - Eyes BreakdownHBAR is currently facing notable selling pressure, as indicated by its Chaikin Money Flow (CMF) reading on the daily chart. The CMF is sitting at -0.07 and trending downward, signaling that more money is flowing out of the asset than into it.
For those unfamiliar, the CMF measures buying and selling pressure by combining price and volume data over a given period. A positive CMF reading suggests strong buying interest, while a negative value points to dominant selling activity.
In HBAR’s case, the negative CMF confirms traders are exiting positions, which adds to the bearish momentum. This persistent outflow of capital could push the price below the lower boundary of its current trading range, potentially signaling further downside ahead.

$HBAR Is Loading… $0.30 Next?CRYPTOCAP:HBAR has turned its key resistance into support, showing a strong shift in market structure. After reclaiming this level, price has been holding steady above it, supported by the 100 EMA.
As long as bulls defend this zone, the next upside target could be the $0.30 area and beyond.
A clean breakout above that level could open the door for further gains.
DYOR, NFA

Hedera (HBAR): Looks Good For Another 15% Upside MoveAnother BOS that caught our attention happened on HBAR coin, where recently after the local breakout we are seeing a smaller struggle, which might send the price back for a quick retest, where we will be sitting in one of our entry zones. forlong position.
The second one is the other green line, which would mean. we form another BOS (on top of the current BOS). Seems good so as long as we are above the 4 hr 200 EMA, we are bullish!
Swallow Academy

HBAR Elder-Ray Index Signals Sustained Selling PressureHBAR’s Elder-Ray Index has remained in negative territory for the past six consecutive daily sessions, reflecting a persistent accumulation weakness. This momentum indicator compares price action to a moving average to gauge the balance between buying and selling pressure. Positive values typically indicate buyer control, while negative readings point to seller dominance.
The current sequence of red histogram bars underscores sustained selling pressure and fading bullish momentum, suggesting that sellers have maintained the upper hand in HBAR’s market over the past week.
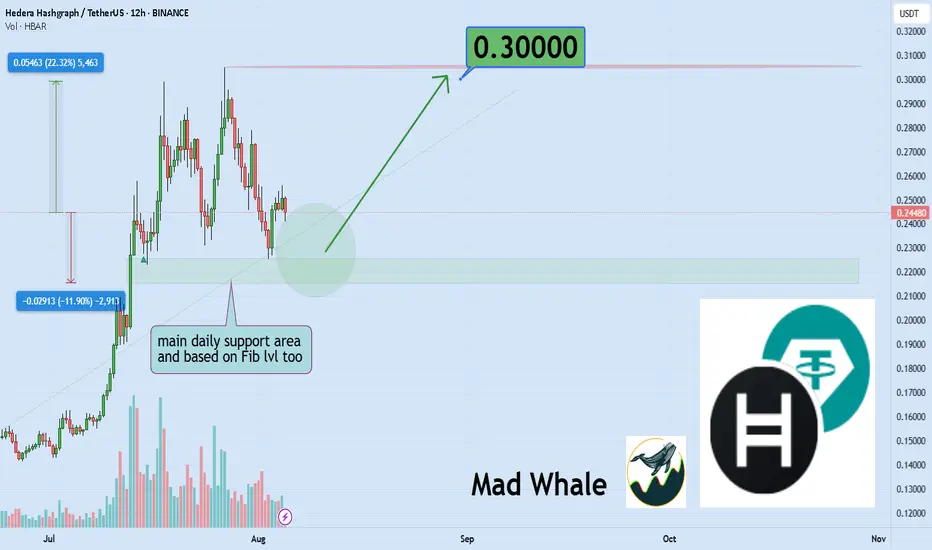
HBAR Set for 22% Rally if Key Support Holds Strong 0.30 targetHello✌
Let’s analyze Hydra Hashgraph’s price action both technically and fundamentally 📈.
🔍Fundamental analysis:
If HBAR’s real use grows, burning fees could rise and boost investor trust. But with 42.4 billion coins out (85% of max), steady demand is needed to handle new unlocks 📊.
📊Technical analysis:
BINANCE:HBARUSDT is currently trading near a confluence of key daily support levels 📉. If this zone holds, the setup suggests a potential upside of around 22 percent toward the 0.30 target 🎯.
✨We put love into every post!
Your support inspires us 💛 Drop a comment we’d love to hear from you! Thanks , Mad Whale
Hedera (HBAR) – Pullback Opportunity After 100% RallyHBAR has surged 100% recently. With the broader market entering contraction, we’re now watching for a healthy retracement into key support, aligning with the 50% Fibonacci level and a fair value gap (FVG). This could be the formation of a higher low before continuation.
🔍 Setup Overview:
Entry Zone: $0.22 – $0.19
Take Profits: $0.26 / $0.32 / $0.37
Stop Loss: Daily close below $0.18
Bias: Bullish continuation from support
🧠 Trade Idea:
Price is approaching a confluence zone of Fib support and unfilled imbalance. As long as daily structure holds above $0.18, the bullish case remains intact. This zone offers an attractive long setup for the next move higher, targeting previous resistance levels.
⚠️ Invalidation:
A daily close under $0.18 would break structure and invalidate the setup. Monitor price action and volume confirmation around this support zone for entry timing.

HBAR - it's time to run away from it Today we dug up a real crypto zombie! HBAR — is it worth touching or better to avoid? Let me explain:
The token was dead for many years after 2021. But suddenly it grew by hundreds of percent after the ETF application was filed.
I will not discuss how useful this project is or not, let's just look at the chart:
➡️ During the last growth impulse, a GAP was formed from below, which has already begun to partially close. At levels of $0.243 - 0.171. In 99% of cases, gaps close sooner or later, continuing to attract price until that moment.
➡️ Volume - divergence in purchase volumes. The price is falling, and sales volumes are also falling. Fewer and fewer people want to sell. But it's too early to rejoice; look at the purchase volumes, they are simply non-existent.
➡️ Money Flow - surprisingly, the picture here is not so bad. Harmony with the price. Liquidity is slowly coming in, but the indicator is already in the neutral zone, even though we are in the midst of a bull market.
➡️ Support/Resistance - the price was unable to overcome even such a weak resistance level as $0.289. This only confirms the complete lack of desire to buy among people.
Yes, of course, no one is selling either, because what is the point of selling in the midst of growth?
➡️ The price is now approaching the support level of $0.235, a level with fairly low interest, and if it cannot hold the price, the next support level will be at the very bottom of the GAP at $0.175.
📌 Conclusion:
It is extremely convenient to trade now, as HBAR is simply flying in both directions like a weather vane. And now, when the correction begins, it will fall sharply.
But don't even think about buying it on the spot. Spare your deposit 😁

HBAR Triangle Tightens: Can Bulls Break $0.27?BINANCE:HBARUSDT continues to form a classic ascending triangle on the daily chart; an overall bullish continuation pattern. While the rising trendline from June shows steady higher lows, the key resistance at $0.27 has capped multiple breakout attempts.
A clean breakout above $0.27 would confirm the pattern, but the real battleground lies at $0.29, which aligns with the Fibonacci extension resistance drawn from BINANCE:HBARUSDT 's prior rally and retracement. If bulls clear this level, the path toward $0.31 and above opens up quickly.
On the downside, the rising support sits near $0.23. A breakdown below that level would invalidate the pattern and weaken the near-term outlook.
Zooming into lower timeframes, the 4-hour RSI shows a clear hidden bullish divergence, where the price made slightly lower highs but RSI climbed from 42 to 52. This often suggests momentum is building beneath the surface, supporting a continuation of the existing uptrend rather than a reversal.
While the BINANCE:HBARUSDT chart setup itself is strong, broader sentiment also supports this bullish lean. On-chain data shows sustained exchange outflows, reflecting investor confidence, and a majority of traders on Binance continue to hold long positions, pointing to a bullish bias in positioning.
Combined, the triangle structure, RSI divergence, and Fib level confluence suggest HBAR could be gearing up for a breakout; if outflows (rising bullish volume) confirm the move.

HYPE LongFollowing a significant decline, the asset will take support and bounce back from this point.
Disclaimer: This is not financial advice.
This algorithm provides highly precise buy and sell signals with alerts:

Hbar dump to $0.22904Just now opened up a short position on hbar.
Sl: $0.24598
Tp: $0.22904
Roughly 2RR from my entry.
