HBAR Bulls Maintain Momentum as Key Resistance LoomsBYBIT:HBARUSDT exhibits a steady uptrend, supported by the 9 EMA remaining above the 20 EMA. This alignment underscores sustained bullish sentiment. However, the MACD histogram's gradual narrowing suggests a possible slowing of upward momentum. RSI readings in the low 60s to 70s indicate moderate bullish strength without nearing overbought conditions.
Hedera is approaching a key resistance level at $0.33433. A breakout above this level could signal further bullish continuation, targeting higher levels near $0.341. On the downside, support levels at $0.30998 and $0.30813 provide critical zones for bulls to defend. Long positions could be considered on a strong breakout above $0.33433, while a pullback to $0.30998 may offer another entry point if bullish indicators hold.
Traders should remain cautious as momentum indicators suggest a possible slowdown. Short positions might be viable near resistance zones if rejection occurs, particularly with confirmation of bearish divergence on key indicators.
HBARUSDT trade ideas


HBARUSDT BULISHAs you may saw before, the target prices are marked on chart.
In this chart you can find the danger zone (it means if the price get to this area, the analysis will fail in short term, Not long term surely :) )
The stop loss area is showing if you are on buy, you can close your positions with minor loss.
Other Ideas :
1.
2.
3.
4.

Public trade #10 - #Hbar price analysis ( Hedera ) The price of CRYPTOCAP:HBAR is holding up very well
1️⃣ OKX:HBARUSDT price should be allowed to fall to $0.265
2️⃣ Although, according to TA canons, it would be nice to “test the strength” of a powerful mirror level around $0.20
Well, we'll soon see what MM #Hedera has in store for us, but in both versions, we can see a target for growth to the ATH area, i.e. $0.57-0.60
_____________________
Did you like our analysis? Leave a comment, like, and follow to get more

HBAR/USDT Breakout Alert: Ready for a 150%+ Pump!!🚀 Hey Traders! 👋
If this setup excites you, hit that 👍 and smash Follow for high-impact trade ideas that deliver real results! 💹🔥
HBAR: Gearing Up for Liftoff! 🚀
HBAR is looking 🔥 right now, breaking out of a bullish pennant-like structure. This could be the start of a massive 150–180% pump! Time to get in and ride the wave. 🌊
📈 Trade Plan:
Entry: CMP (Current Market Price) and add more up to $0.30
Targets: $0.42 / $0.54 / $0.68 / $0.90
Stop Loss: $0.275
Leverage: Keep it low (max 5x)
💡 What’s Your Take?
Do you see HBAR’s explosive potential here? Drop your analysis, strategies, or predictions in the comments below! Let’s conquer this market together and secure those profits! 💰🔥

HBARUSDT
The purple support zone within the price range of $0.232 has been tested multiple times so far. If this support area is breached, we expect the bearish trend to continue towards lower levels.
Upon closer examination, we observe that the resistance zone at $0.3484 has not yet been tested, and the momentum of the bearish trend has been stronger. Once the purple support zone is consumed, the bearish scenario will be further confirmed.
What’s your opinion?

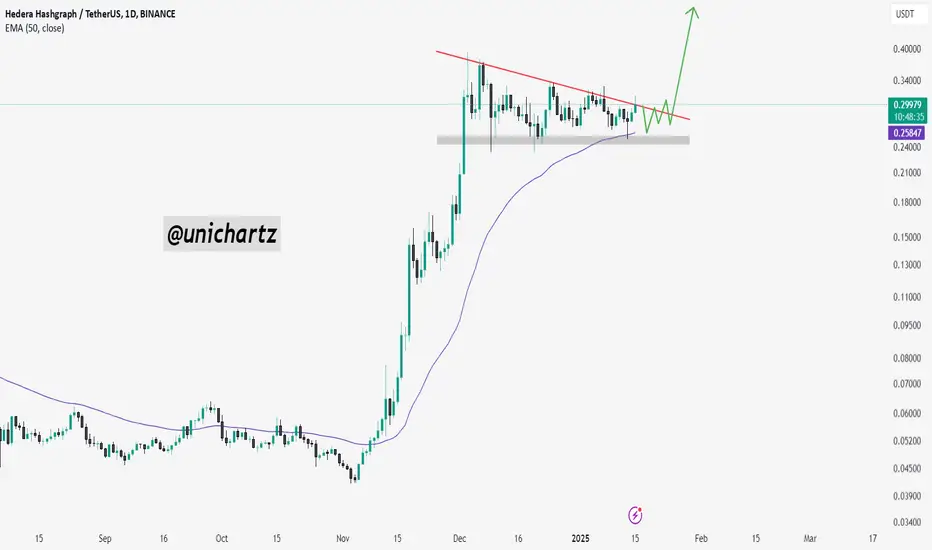
HBAR/USDT Approaches Apex: Bullish Breakout Ahead?HBAR/USDT is currently trading within a bull flag pattern and approaching the apex. A potential bullish breakout may be on the horizon.
The price has faced multiple rejections from the descending trendline but has consistently found strong support at the lower support zone. Keep an eye on the price action for a possible upward move.
DYOR, NFA
HBAR on the Edge: Key Levels You Can't Miss!HBAR has been range-bound for over 40 days, trading between $0.3922 and $0.2341, following a rejection from the golden pocket zone. Let’s dive into the key resistance and support zones to identify potential trade setups.
Support Zone Analysis
Taking the entire bullish run from November, we observe the 0.5 Fibonacci Retracement at $0.2169, which aligns perfectly with the anchored VWAP from the November lows, providing a strong support confluence. Adding to this, the negative Fibonacci extension of the current downside wave places the -0.666 Fibonacci level at $0.21778, further reinforcing this zone.
Additionally, the lows around this area contain significant liquidity, likely targeting long-leverage positions, which increases the conviction for this support zone. The monthly level at $0.2217 also aligns with this area, making $0.217-$0.222 a highly reliable support zone for potential trade setups.
Resistance Zone Analysis
HBAR has recently broken below the yearly open level at $0.269, which now acts as a resistance.
For those who missed the previous short entry, price action near $0.269 presents another opportunity for a short trade if price rises to this level, confirming its resistance.
Chart Pattern & Volume Analysis
The structure shows an inverted cup and handle pattern. Volume has been in steady decline throughout this trading range, indicating a pause in bullish momentum.
Trade Setups
Short Trade
Entry: Around $0.269 (yearly open and key resistance zone)
Stop-Loss: Above $0.285
Target: Support zone at $0.217-$0.222
Long Trade
Entry: Around $0.217-$0.222
Stop-Loss: Below $0.210.
Target: Retest of the previous lows at $0.235
R:R: 2:1, making it a decent trade.

HBARUSDT UPDATEHBARUSDT is a cryptocurrency trading at $0.30268. Its target price is $0.42000, indicating a potential 40%+ gain. The pattern is a Bullish Pennant, a continuation pattern signaling a potential breakout. This pattern suggests a brief consolidation before a strong upward move. The Bullish Pennant is a positive signal, indicating a potential price surge. Investors are optimistic about HBARUSDT's future performance. The current price may be a buying opportunity. Reaching the target price would result in significant returns. The Bullish Pennant pattern typically leads to a strong upward move. A breakout from this pattern could propel HBARUSDT to its target price.


H-Bar Movement in 2025H-Bar appears to be in a channel of movement, reflecting its potential as we approach this year's anticipated Alt Season. With the possibility of ETF approvals and positive news surrounding this token, there’s a reasonable expectation for upward momentum in the near future.
Interestingly, many early investors who acquired H-Bar at significantly lower levels seem to be holding onto their positions rather than selling at current prices. This behavior suggests confidence in further price appreciation, especially with the Alt Season and 2025 on the horizon. If selling were their intention, it would have made more sense to do so before these pivotal events.
However, the market might experience increased volatility in the next 1-2 weeks. Bear traps and fear could be strategically induced to shake out weaker hands, encouraging more people to sell prematurely. It's essential to have a clear strategy and avoid panic selling ("pink sold").
For those considering an entry, these could be some of the last optimal buying opportunities before a potential upward surge. As prices rise, early investors may begin securing profits, which could limit the extent of further gains. Additionally, even with negative news, the market might show resilience, suggesting a shift toward a more bullish sentiment.
If you’re planning to enter, now might be the time to act thoughtfully. Waiting too long could lead to FOMO (fear of missing out) and becoming a "big bait" for sellers at elevated price levels.
Always approach investments with a clear strategy, and remember to manage risk appropriately.

HBAAARRRR - ROAAR like a Cat.Pretty simple follow the arrows its a reposted idea of mine so slow much wow and much good for you to follow.

SPOT HBAR LONG 11.01.2025Pinning after containment of sales.
🎯Purpose:
0.33904
I'll let you know when I record it manually.
‼️Risk per trade: 1% of the allocated funds for spot trading.
Thank you for follow and the reaction🚀.


HBAR 1:3 rrrThe Hedera Hashgraph (HBAR/USDT) chart on the daily timeframe shows a potential breakout above the descending trendline, signaling a bullish reversal. The risk/reward ratio of 3 suggests a favorable trade setup, targeting the 0.47 resistance level (+59.59%) while placing a stop-loss at 0.236 (-19.85%). This trade capitalizes on the higher lows (HLs) forming, indicating building bullish momentum. Volume profile analysis also highlights strong support around the stop level, reinforcing the validity of the setup.

Short & Long Setup for H-BarHey everyone,
It looks like H-Bar couldn't sustain its upward momentum despite having all the right conditions in place. With Bitcoin's recent drop, H-Bar also lost its support level.
Over the past few months, H-Bar's price movements have been driven purely by user activity—buying and selling—without any noticeable support or intervention from market makers to push the price higher.
It seems the price may need to dip further to attract Smart Money, and we could see a significant movement once news or key events create the right conditions.
Just a friendly reminder: this isn't financial advice, so please make your decisions responsibly! 😊

HBAR bull flagHBAR is in a 38 day range bull flag while sitting on strong support at between .26 and .27 cents. I'm very bullish on HBAR. The year is just getting started.

HBAR 4hr Textbook PennantThis flag is my first publish. I can't help but see the textbook flag/pennant on this 4 hr. I have a bias to the up side, but I am neutral until it has a full candle close above or below the trendlines. I am definitely taking a position with one candle close above or below the trendlines.

HBAR Wave 4 update - Elliott WaveSo green scenario removed as expected.
Orange triangle in play still - invalidation level seems to be in confluence with the VAL since the end of wave 3.
2 purple ABC scenarios? Both look similar in terms of expectations for the C wave.
Any comments welcome.
Novice EW follower.

HBARmaybe i can be wrong, but after doing a good research, analyzing the volume, the different TF
it could be that during 2-3 days we could see this spike with HBAR.
nfa
dyor
please never trade without SL

HBAR wave 4 - elliott wave
Trying to assess probability of where we are in HBAR wave 4.
Green - unlikely? Direct bullish case - looks like a diagonal?
Purple - is the recent local top a wider wave B than I have on the chart and we should expect a wave C down?
Triangle - is this playing out - was it technically invalidated, also could it be wider than marked?

HBARUSDT UPDATEHBARUSDT is a cryptocurrency trading at $0.32332. Its target price is $0.46000, indicating a potential 50%+ gain. The pattern is a Bullish Pennant, signaling a brief consolidation before a breakout. This pattern suggests a continuation of the upward trend. Investors are optimistic about HBARUSDT's future performance. The Bullish Pennant is a positive signal, indicating a potential price surge. The current price may be a buying opportunity. Reaching the target price would result in significant returns. Overall, HBARUSDT's Bullish Pennant pattern makes it an attractive investment option. This pattern typically leads to a strong upward move.

