HBAR Price Stalls at Major Support After Sharp SelloffCOINBASE:HBARUSD price has paused after a sharp selloff, down around 17% over the past seven days and nearly 24% month over month. The decline has now slowed near the $0.113 zone, a level that has started acting as short-term support.
Momentum remains weak. The Chaikin Money Flow (CMF), which trac
Trading activity
Transactions 87
BuysSells
4443
Volume 6.74 KUSD
Buys volumeSells volume
3.23 K3.51 K
Traders 52
BuyersSellers
2626
About HBARWCRO_E9DA95.USD
Related DEX pairs

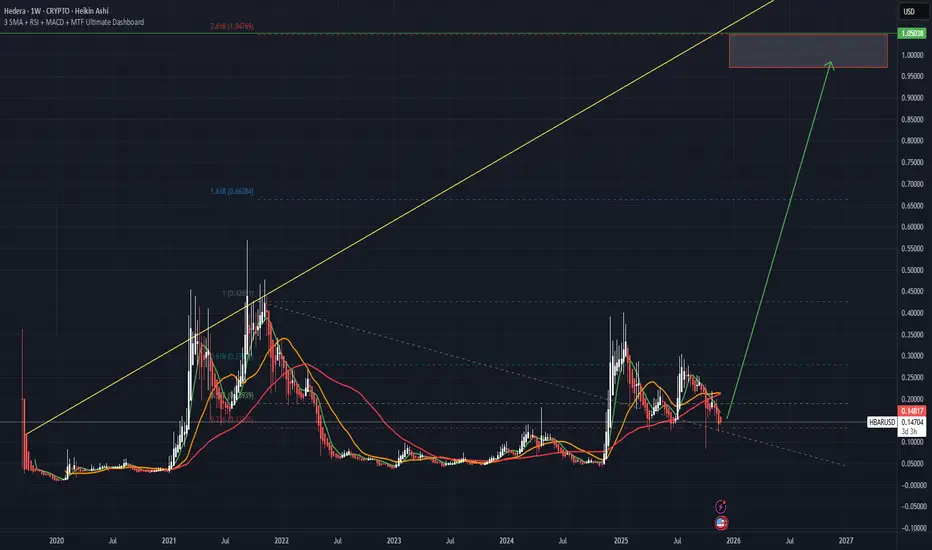
HBARUSD lost its 1W MA200 also. Collapse imminent.Hedera (HBARUSD) is about to close its 1W candle below the 1W MA200 (orange trend-line) for the first time since November 11 2024. This is a huge development as this has been its long-term Support, which even though it broke on 3 separate occasions in 2025, it ever closed a week below it and always

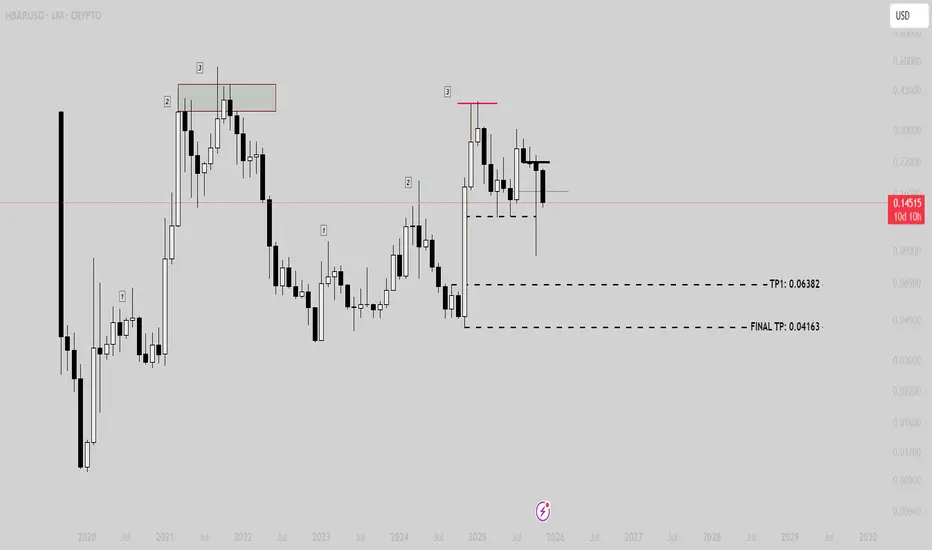
HBAR continues to eek towards its next major decision. This is going to resolve very soon.
You can see an obvious monthly triangle pattern heading towards it's decision point.
If it dips to that 6 cent range, it'll be a major buying opportunity.
Lets make sure the body of the monthly candle confirms first.

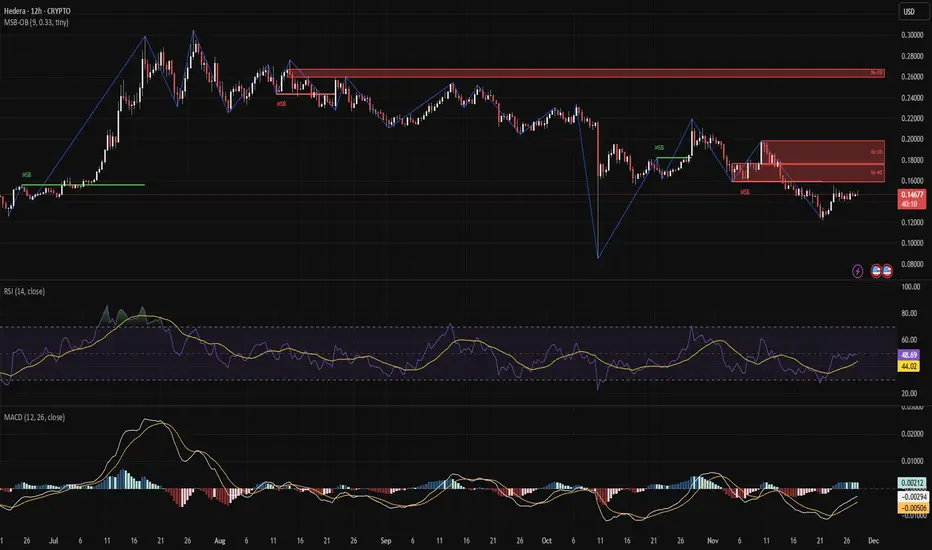
HBAR Still Stuck Under Key Resistance – No Bullish Break YetHBAR continues to range just under the 0.16–0.20 resistance, rejecting the supply zone and showing no bullish market structure break.
MACD and RSI are weak, hovering near neutral. Buyers need to break 0.18 cleanly to shift this trend. Until then, structure remains heavy.
Price is consolidating — b
HBARUSD - HEDERA entering bull seasonHi,
I do like US coins lately because there are institutions involved and a lot of capital.
Hedera already working with giants as BlackRock and Fidelity.
This is not a trading advice.
Thanks
Gex
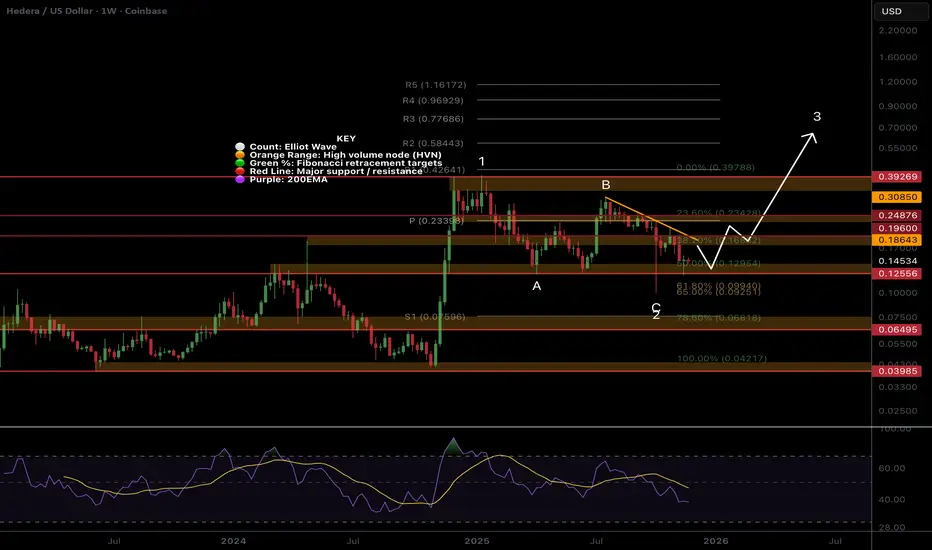
HBAR still holding strongCRYPTOCAP:HBAR Price has printed a textbook ABC for wave 2, but as long as we are below the descending trend-line, the probability is lower still. The wick has now been revisited, which is expected behaviour.
Price is below the weekly pivot. The next downside target is the S1 pivot at $0.075, whic
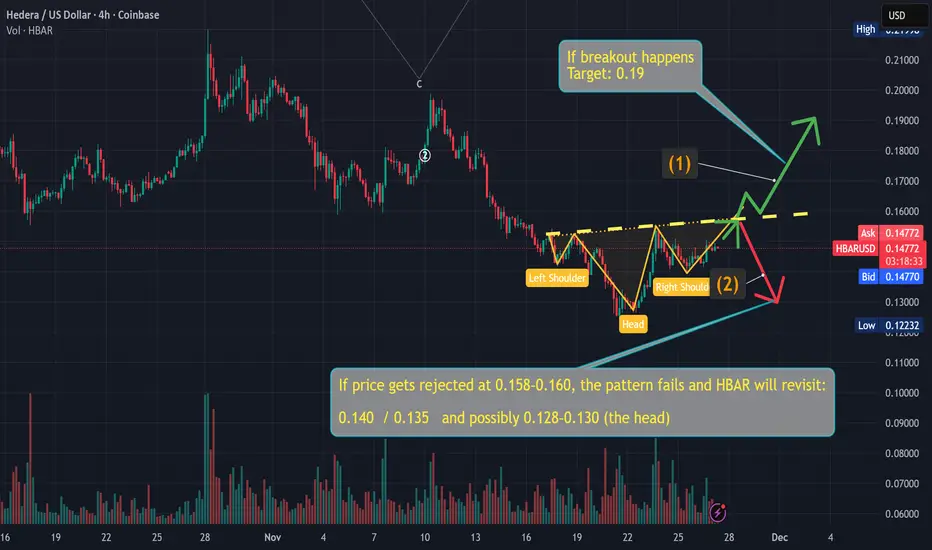
HBAR: Inverse Head & Shoulders Forming — Breakout or Breakdown ?HBAR – Inverse Head & Shoulders Forming? Key Breakout Level Ahead (0.158–0.160)
HBAR is potentially forming a bullish Inverse Head & Shoulders on the 4H timeframe, but the pattern is not confirmed yet. The neckline sits right at the 0.158–0.160 zone, which is the critical inflection point for the n
Hedera ( $HBARUSD)Targets Breakout as Adoption AcceleratesHedera trades near $0.143 after bouncing from the recent $0.129 support. The market now focuses on the push toward $0.160, a level that capped multiple rallies. This move happens inside a structure defined by a long-term descending trendline formed after the July 2025 peak at $0.30. Traders want to

HBAR still in the channel!Price is back in the descending range after dropping below during the flash crash, which can be viewed as an anomaly.
Wave 2 appears complete at the golden pocket Fibonacci retracement. Price was rejected at the daily 200EMA and channel upper boundary and has lost the daily pivot and High Volume No

$HBARThese are my targets for HBAR. Currently, I don't see any bullish signs, so this is my primary analysis for HBAR right now.
See all ideas
Summarizing what the indicators are suggesting.
Oscillators
Neutral
SellBuy
Strong sellStrong buy
Strong sellSellNeutralBuyStrong buy
Oscillators
Neutral
SellBuy
Strong sellStrong buy
Strong sellSellNeutralBuyStrong buy
Summary
Neutral
SellBuy
Strong sellStrong buy
Strong sellSellNeutralBuyStrong buy
Summary
Neutral
SellBuy
Strong sellStrong buy
Strong sellSellNeutralBuyStrong buy
Summary
Neutral
SellBuy
Strong sellStrong buy
Strong sellSellNeutralBuyStrong buy
Moving Averages
Neutral
SellBuy
Strong sellStrong buy
Strong sellSellNeutralBuyStrong buy
Moving Averages
Neutral
SellBuy
Strong sellStrong buy
Strong sellSellNeutralBuyStrong buy
Curated watchlists where HBARWCRO_E9DA95.USD is featured.

Eco-friendly crypto tokens: Green cryptocurrencies
14 No. of Symbols

Top altcoins: Choose your alternatives carefully
28 No. of Symbols
See all sparks