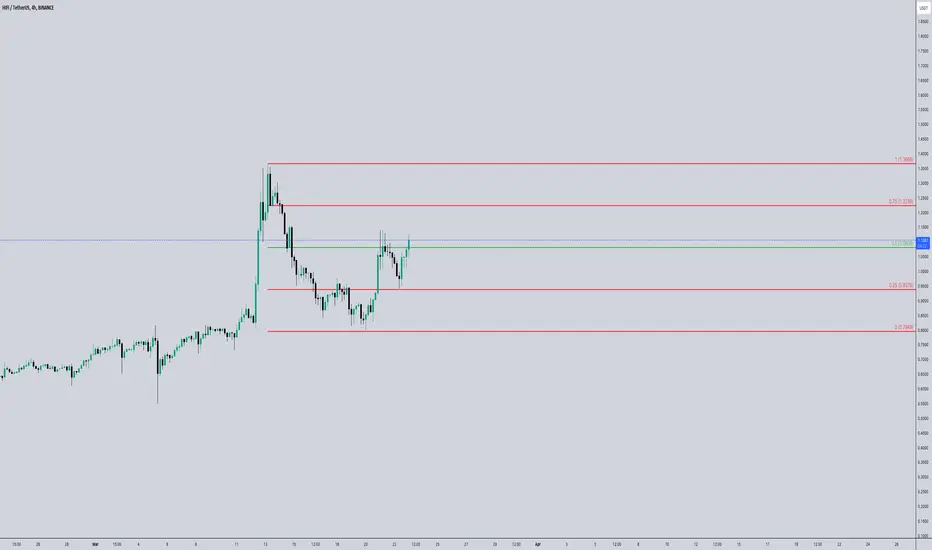
HIFI ANALYSIS (4H)From where we put the green arrow on the chart, it looks like a triangle is forming on the chart.
It seems that we are now in wave D of this triangle.
The E wave can start from the green range.
We are looking for buy/long positions in the green range.
Closing a daily candle below the invaliation level will violate the analysis.
For risk management, please don't forget stop loss and capital management
When we reach the first target, save some profit and then change the stop to entry
Comment if you have any questions
Thank You
Trade ideas

HIFIUSDT.PHIFIUSDT.P is in bullish trend.
Potentially printing HH and HL.
Bullish continuation flag also form.
No sign of reversal here.
We wait and watch for the breakout of flag pole.

HIFI/USDT DAILY ANALYSIS Price broke and closed above Saturday's daily Candlestick and now it is coming back to retest that high,and most likely reverse to the upside.

HIFI ANALYSIS#HIFI Analysis : Channel Breakdown
📊As we can see that #HIFI was following ascending channel on 4hr time frame. But we can see a breakdown and 2 times retest the same channel. Right now there is a major support level at 0.4855 and if #HIFI breakdown that level then we would see a dump otherwise it will take reversal from its major support zone.
⁉️ What to do?
- Keep your eyes on the chart, observe trading volume and stay accustom to market moves.🚀💸
#DYOR #CRYPTOCURRENCY

HIFIUSDTWe can attempt to buy HIFIUSDT from specified level as it break LH , also bullish divergence occur indicate that it moves upward.
SL , TP mention in chart.

HIFIUSDT.PHIFIUSDT.P is in bullish trend.
POtentially printing HH and HL.
No sign of reversal we wait and watch for the breakout of last HH.

$HIFIShort position with stop loss at $0.4788
Please DYOR before take a position.
Always use stop loss and manage your own risk!!

Hifi BINANCE:HIFIUSDT
Price : Buy some right Ad always use stop loss market is volatile
Trade Care any coin positions
CPI Data Is Coming After an Hour, Volatility Will Be High😬
After The Previous CPI Data The Market Dumped Very Hard📉(Anything Could Happen Today)
Must Use Stop Loss On Your Trades And If You Are In Profit In Any Trade Then Move Stop Loss To Entry
Disclaimer : I am not Financial Advisor

just an IDEA ( HIFI )HIFI - 4H
Please read the 1D chart explanation first.
Bullish Scenario:
If the price breaks above the immediate resistance at 0.8310 and sustains above the 200 EMA, we could reach the 0.8943 level, which is the top of our triangle. A strong breakout can lead us to 1.30 later.
Bearish Scenario:
If the price fails to hold the ascending trendline and drops below the 0.7098 support, it is possible that we will see lower prices. However, we need to observe the reaction at this level first to make a decision.
A breakout in either direction could signal the next significant move. Traders should watch for a confirmed breakout with volume for clearer direction.
let me know what you think

just and IDEA ( HIFI )HIFI - 1D
After a rejection around 1.30, we moved down to 0.60. However, the good thing is we didn't make any new low. After that, the price got into a range box between 0.71 to 0.89 for almost 2 months. Volume has been relatively low, indicating that this area is no longer interesting for buyers or sellers.
Right now, we are in the middle of the range box, and the 200 EMA is currently acting as dynamic support around the 0.8 level. The price is hovering around this area, indicating a critical support zone.
Additionally, there seems to be a symmetrical triangle forming, with a lower boundary (uptrend line) and an upper trendline. The price is consolidating within this triangle, indicating a potential breakout soon. The breakout direction is uncertain, but typically, the pattern suggests a continuation of the previous trend before the consolidation.
RSI is Approximately around 47.77, which is neutral (neither overbought nor oversold). The trend line in the RSI seems to act as support, and we are forming higher lows. As long as we maintain that trend line and don't fall below it, I think we are in good shape.
Bullish Scenario:
If the price breaks above the 0.8797 resistance, it could test higher resistance levels at 1.3067 and 1.52.
A successful breakout above the symmetrical triangle pattern, supported by increased volume, would confirm this bullish move.
Bearish Scenario:
If the price falls below the immediate support at 0.80, it could test lower support levels at 0.7110 and further down to 0.6040.
A breakdown below the symmetrical triangle pattern, supported by increased volume, would confirm this bearish move and could potentially see lower price.
Conclusion:
The price is currently consolidating within a symmetrical triangle pattern near a critical support level at the 200 EMA. The RSI is neutral but showing a potential bullish divergence with higher lows. A breakout in either direction could signal the next significant move. Traders should watch for a confirmed breakout with volume for clearer direction.
let me know what you think please.

HIFIUSDT | Ready for a Move Higher?Market Context
Is HIFIUSDT poised to climb from this point? It’s looking possible!
Chart Analysis
We recently hit a new low on the daily chart, thanks to a Friday flush. However, this could be the recovery point we’ve been waiting for. Today’s price action hints at a potential false break on the daily timeframe, setting the stage for a rebound.
Strategy
This is a risky trade, but I’m a risk-taker! I’m betting on a bounce and aiming for our profit target. Let’s see if HIFI hits the right notes and moves higher!
Stay tuned for updates and let’s watch this play out!

Upper resistance lineHIFI is currently trading within a triangular pattern and is attempting to break through the upper resistance line, which coincides with the 0 Fibonacci resistance level. Successfully breaking this resistance would pave the way for HIFI to challenge the next resistance level.

#HIFI has formed an ascending triangle pattern on the 8-hour tim#HIFI has formed an ascending triangle pattern on the 8-hour timeframe
Price is positioned for a potential breakout from this pattern, which could lead to a bullish price move of approximately 40%


HiFi BO and PullBackIt seems that the downward trend line has been broken and the price has pulleback to it and is on the EMA50 support

Hifi/Usdt Plan Hifi/USDT) appears to be on the verge of a potential breakout, with indications pointing towards a forthcoming bullish movement. It is advised to closely monitor this pairing for a potential successful breakout in the near future. If the breakout occurs as anticipated, there is a possibility of a significant bullish move of approximately 40% to 80% in the short term.
It is important to note that the information provided here is not financial advice. As always, it is recommended to conduct your own research (DYOR) and exercise caution when making investment decisions. It is essential to gather comprehensive information from various sources before engaging in any trading activities.
Monitoring key technical indicators, market trends, and potential catalysts can aid in gaining a better understanding of the market conditions surrounding HiFi/USDT. Stay informed and remain vigilant in order to make well-informed decisions regarding your investments.

PLAN $HIFI for super megacycle
$HIFI is currently continuing its supercycle wave 1. Keep holding for the #RWA narrative.

HIFI is next on the listHello, Im going after HIFI, strong mid range claim - aiming for $2 but taking TPs all the way up
hifi can go to 2xon sk system with fibonacci levels HIFI$ can go to 2.4$
maybe we have correctionand it go 1$ then up or without correction go up
i draw two scenario with red abc and black abc

#RWA Sector is still below $10bln😳#RWA Sector is still below $10bln😳
Here are 🏆TOP 7 Solid Projects to HODL (IMO)💁♂️
1. #Mantra NASDAQ:OM | Market Cap $580mln
The first RWA Layer 1 Blockchain, capable of adherence and enforcement of real world regulatory requirements.
TA: Massive Rounding Bottom, most likely we see C&H before Major Supply will be broken.
2. #DuskNetwork $DUSK | Market Cap $275mln
Dusk is a permissionless, ZK-friendly L1 blockchain protocol focused on Compliance and Privacy to tokenize RWA.
TA: Accumulating below 1$ - Ascending Triangle formation
3. #OndoFinance LSE:ONDO | Market Cap $1.3bln
The next generation of financial assets and autonomous infrastructure, offered with world-class client service.
TA: Solid growth, not much of TA here but we are still below 1$ so good buy IMO
4. #LTONetwork GETTEX:LTO | Market Cap $110mln
LTO Network is a Layer 1 blockchain with a Public and Private layer to bridge the gap between real-world and digital ownership, decentralized identities, and privacy.
TA: Broke out of double bottom accumulation, but we are yet to see a breakout of the bigger range
5. #Opulous $OPUL | Market Cap $110mln
Home of Real World Assets for Music on Blockchain. Unlock the music industry with AI-driven transparency.
TA: Breakout of Double Bottom accumulation
6. #Polymesh $POLYX | Market Cap $600mln
Polymesh is an institutional-grade permissioned blockchain built specifically for regulated assets. It streamlines antiquated processes and opens the door to new financial instruments by solving the challenges around governance, identity, compliance, confidentiality, and settlement.
TA: Breakout of 518 Days accumulation - iH&S. Still a lot of potential for upside
7. #HIFIFinance $HIFI | Market Cap $152mln
Fixed-rate borrowing against digital and real-world assets on Ethereum.
TA: Breakout of C&H accumulation

HIFI/USDT BIG BREAKOUT LOADING HiFi/USDT
HiFi/USDT price is currently in the process of forming a symmetrical triangle pattern on the 4-hour time frame. A breakout is anticipated due to some positive news circulating about this coin. In the event of a breakout, a potential bullish movement of 80-160% is expected.
Please note that the information provided is not financial advice.

HIFI USDT Technical Analysis# HIFI USDT Technical Analysis
## Time Frame
4-hour chart
## Indicators
1. **RSI (Relative Strength Index)**: The RSI is currently around 50, indicating a neutral market condition. This suggests that neither the bulls nor the bears are significantly controlling the market direction.
2. **Stoch RSI**: The Stoch RSI is around 35, which is neither in the overbought nor oversold territory. This indicates that the market is currently balanced.
3. **EMA (Exponential Moving Average) and SMA (Simple Moving Average)**: The EMA and SMA lines are visible below current price levels indicating potential bullish momentum if prices stay above these lines.
4. **Support and Resistance Levels**: There are horizontal lines drawn on the chart indicating potential support and resistance levels. These levels can act as barriers from which the price tends to bounce back.
5. **Volume**: The volume bars at the bottom in green and red colors indicate buying and selling volumes respectively.
6. **Trend Line**: A downward trend line has been drawn connecting previous highs showing an ongoing bearish sentiment until it's broken upwards.
## Conclusion
Based on the current indicators, the market appears to be in a neutral state. Traders should watch for potential breakouts from the identified support and resistance levels for trading opportunities.
Please note that this analysis is based on the current state of the market and past performance is not indicative of future results. Always do your own research before making any trading decisions. This analysis is for research purposes only and should not be considered as financial advice.
