Elevate Your Portfolio with Xinyi Solar: A Comprehensive TradingIn this exciting video, we're delving into a powerful trading idea centered around Xinyi Solar Holdings (XYSF). Xinyi Solar, a leading solar energy solution provider, presents a promising opportunity for traders seeking to maximize profits in the renewable energy sector.
Join us as we dissect:
📈 A
Xinyi Solar Holdings Ltd.
No trades
Next report date
—
Report period
—
EPS estimate
—
Revenue estimate
—
1.09 B HKD
23.77 B HKD
4.51 B
About Xinyi Solar Holdings Ltd.
Sector
Industry
CEO
Shing Put Lee
Website
Headquarters
Wuhu
Founded
1988
IPO date
Nov 22, 2013
Identifiers
3
ISINKYG9829N1025
Xinyi Solar Holdings Ltd. engages in the manufacture and sale of solar photovoltaic glasses. It operates through the following segments: Sales of Solar Glass, Solar Farm Business, and EPC Services. The Sales of Solar Glass segment consists of sales from the production of solar glass products. The Solar Farm Business segment includes solar farm development and solar power generation. The EPC Services segment refers to the provision of engineering, procurement, and construction services. The company was founded 1988 and is headquartered in Wuhu, China.
Related stocks

Short closed in interesting area Another position opened and closed in profit, and the price rich a level and an interesting area between the level price of 8.70 and 8.01 let's see if the stock will use this area to accumulate before the broken, continuing the downtrend or will use as a support to start a new up trend.
My vision i

Xinyi Solar offers Selling SignalXinyi Solar (968.HK), the largest solar glass manufacturer in China, is on a downward trend. Compared with its downturn in the industry, the share price is not easy to recover. It is ideal to wait at the sideline until the stock price had sharp correction.

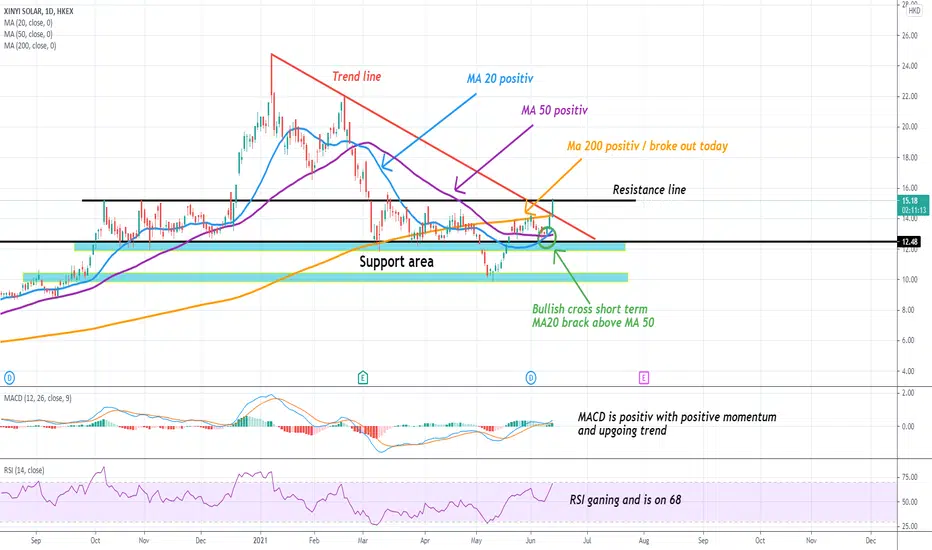
WATCH $968Bullish
Fundamental
- Leading industry
- healthy fundamental
-
TA
- Correction momentum is diminishing forming a potential bullish pennant
- Price is still within upward trend
- Price is under pressure with POC level
- Will be keen
1) price above POC
2) price above 200MA
3) price breakout

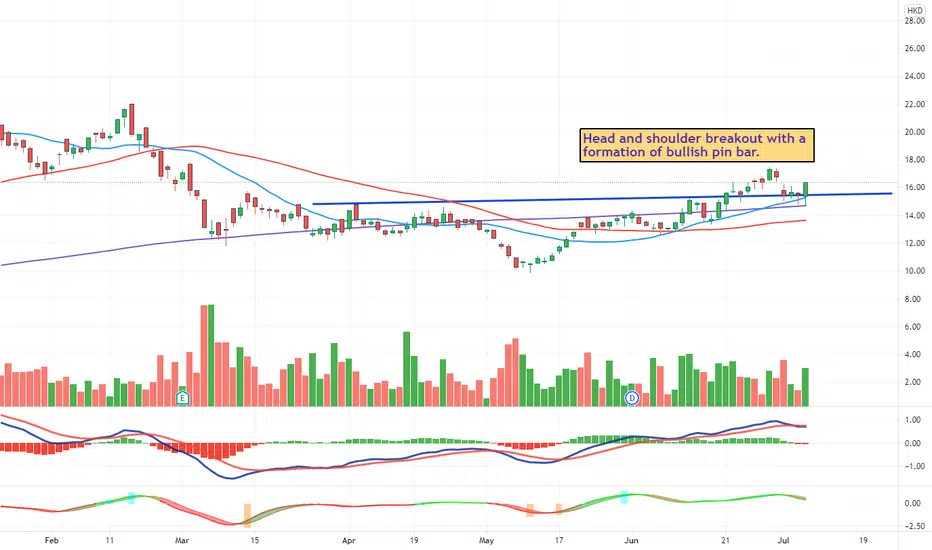
0968.hk Xinyi Solar Head & Shoulders patternXinyi Solar (0968.hk) completed a 3 month long Head & Shoulders pattern. We already have a breakout last week. We are now in the retracement phase. As this is now at a good entry-level, we're set to get in on the next red candle.
Intermediate Price Targets: 12.50, 10 ==> important support levels

Solar energy sector could be near to start another rally It doesn't really matter much which one you choose, they move pretty much the same.
They may have hit a bottom on May 13.
They have been falling since January.
I think they are still far from reaching their absolute maximums.
NYSE:SOL
AMEX:TAN
NASDAQ:FSLR
HKEX:968
NYSE:JKS
NASDAQ:ICLN


See all ideas
Summarizing what the indicators are suggesting.
Neutral
SellBuy
Strong sellStrong buy
Strong sellSellNeutralBuyStrong buy
Neutral
SellBuy
Strong sellStrong buy
Strong sellSellNeutralBuyStrong buy
Neutral
SellBuy
Strong sellStrong buy
Strong sellSellNeutralBuyStrong buy
An aggregate view of professional's ratings.
Neutral
SellBuy
Strong sellStrong buy
Strong sellSellNeutralBuyStrong buy
Neutral
SellBuy
Strong sellStrong buy
Strong sellSellNeutralBuyStrong buy
Neutral
SellBuy
Strong sellStrong buy
Strong sellSellNeutralBuyStrong buy
Displays a symbol's price movements over previous years to identify recurring trends.
513980
INVESCO Great Wall CSI Hong Kong Connect Technology Index Exchange Traded Fund UnitsWeight
0.33%
Market value
6.80 M
USD
159691
ICBCCS CSI Hong Kong Connect High Dividend Yield Select ETF UnitsWeight
0.53%
Market value
4.64 M
USD
Explore more ETFs
Frequently Asked Questions
The current price of 968 is 3.02 HKD — it has increased by 1.68% in the past 24 hours. Watch Xinyi Solar Holdings Ltd. stock price performance more closely on the chart.
Depending on the exchange, the stock ticker may vary. For instance, on HKEX exchange Xinyi Solar Holdings Ltd. stocks are traded under the ticker 968.
968 stock has risen by 3.78% compared to the previous week, the month change is a −7.08% fall, over the last year Xinyi Solar Holdings Ltd. has showed a −0.33% decrease.
We've gathered analysts' opinions on Xinyi Solar Holdings Ltd. future price: according to them, 968 price has a max estimate of 5.35 HKD and a min estimate of 1.92 HKD. Watch 968 chart and read a more detailed Xinyi Solar Holdings Ltd. stock forecast: see what analysts think of Xinyi Solar Holdings Ltd. and suggest that you do with its stocks.
968 stock is 4.75% volatile and has beta coefficient of 0.96. Track Xinyi Solar Holdings Ltd. stock price on the chart and check out the list of the most volatile stocks — is Xinyi Solar Holdings Ltd. there?
Today Xinyi Solar Holdings Ltd. has the market capitalization of 27.62 B, it has decreased by −0.34% over the last week.
Yes, you can track Xinyi Solar Holdings Ltd. financials in yearly and quarterly reports right on TradingView.
Xinyi Solar Holdings Ltd. is going to release the next earnings report on Mar 2, 2026. Keep track of upcoming events with our Earnings Calendar.
968 earnings for the last half-year are 0.09 HKD per share, whereas the estimation was 0.09 HKD, resulting in a 0.00% surprise. The estimated earnings for the next half-year are −0.28 HKD per share. See more details about Xinyi Solar Holdings Ltd. earnings.
Xinyi Solar Holdings Ltd. revenue for the last half-year amounts to 11.98 B HKD, despite the estimated figure of 11.98 B HKD. In the next half-year revenue is expected to reach 7.69 B HKD.
968 net income for the last half-year is 801.05 M HKD, while the previous report showed 1.96 B HKD of net income which accounts for −59.18% change. Track more Xinyi Solar Holdings Ltd. financial stats to get the full picture.
Xinyi Solar Holdings Ltd. dividend yield was 3.18% in 2024, and payout ratio reached 81.83%. The year before the numbers were 4.93% and 47.83% correspondingly. See high-dividend stocks and find more opportunities for your portfolio.
As of Dec 25, 2025, the company has 9.64 K employees. See our rating of the largest employees — is Xinyi Solar Holdings Ltd. on this list?
Like other stocks, 968 shares are traded on stock exchanges, e.g. Nasdaq, Nyse, Euronext, and the easiest way to buy them is through an online stock broker. To do this, you need to open an account and follow a broker's procedures, then start trading. You can trade Xinyi Solar Holdings Ltd. stock right from TradingView charts — choose your broker and connect to your account.
Investing in stocks requires a comprehensive research: you should carefully study all the available data, e.g. company's financials, related news, and its technical analysis. So Xinyi Solar Holdings Ltd. technincal analysis shows the sell today, and its 1 week rating is sell. Since market conditions are prone to changes, it's worth looking a bit further into the future — according to the 1 month rating Xinyi Solar Holdings Ltd. stock shows the sell signal. See more of Xinyi Solar Holdings Ltd. technicals for a more comprehensive analysis.
If you're still not sure, try looking for inspiration in our curated watchlists.
If you're still not sure, try looking for inspiration in our curated watchlists.