TCOM , TradesWas on my long watchlist and looked like a good intraday short , not interested in longs below GLB.
Just scanning my watchlist looking for intraday lately to try to see some green pnl.
Kind of ran out of time on the first trade shown on chart but still showed a small gain ...
Next report date
—
Report period
—
EPS estimate
—
Revenue estimate
—
51.5 HKD
18.50 B HKD
57.78 B HKD
599.80 M
About Trip.com Group Ltd.
Sector
Industry
CEO
Jie Sun
Website
Headquarters
Singapore
Founded
1999
ISIN
KYG9066F1019
FIGI
BBG00ZXXNWN2
IPO date
Apr 19, 2021
IPO offer price
34.47 USD
Trip.com Group Ltd. is a global one-stop travel platform, integrating a comprehensive suite of travel products and services and differentiated travel content. It provides hotel accommodations, airline tickets, packaged tours, corporate travel management services, property management systems and advertising services. The firm operates under a portfolio of brands, including Ctrip, Qunar, Trip.com and Skyscanner. The company was founded by Jian Zhang Liang, Min Fan, Nan Peng Shen and Qi Ji in June 1999 and is headquartered in Singapore.
Related stocks


TCOM Trip(.)com Group Limited Options Ahead of EarningsIf you haven`t bought the dip op TCOM:
Now analyzing the options chain and the chart patterns of TCOM Trip(.)com Group Limited prior to the earnings report this week,
I would consider purchasing the 60usd strike price Puts with
an expiration date of 2024-12-20,
for a premium of approximately $3.70

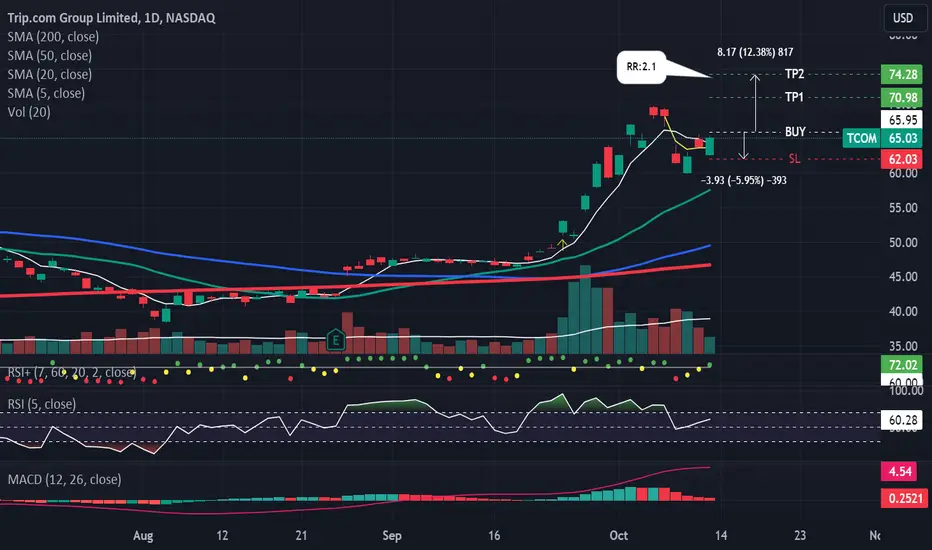
My Watchlist: TCOMTCOM: I have a green setup signal(dot Indictor). It has an excellent risk-to-reward ratio(RR:). I'm looking to enter long near the close of the day if the stock can manage to CLOSE above the last candle highs(white line). If triggered, I will then place a stop-loss below(SL) and a price target above
TRIP.com / Beginning of Up Trend Stock Beginning of the trend Stock, breaking the Wyckoff accumulation Phase
and has Volume Profile Normal Distribution Support
The volume from Accumulation Phase has not yet been sold out. It can continue with accumulated volume with first target at 261.8 Fibonacci Retracement and cluster with 161.8 of F

TCOM Options Ahead of Earnings If you haven`t bought TCOM before the previous earnings:
Then analyzing the options chain and the chart patterns of TCOM prior to the earnings report this week,
I would consider purchasing the 55usd strike price in the money Calls with
an expiration date of 2024-9-20,
for a premium of approximatel

TCOM, 2/27-4/3, 9.5% profitOn 2/21/2024, Trip.com Group Limited (TCOM) reported earnings of $0.62 per share on revenue of $1.45 billion for the fourth quarter ended December 2023. The consensus earnings estimate was $0.33 per share on revenue of $1.43 billion.

Ascending triangle in formationA nice growth of at least 30% after the following consolidation zone. It can take the form of a bullish triangle for the next days-weeks.

TCOM Amazing Recovery StoryFinancial Performance and Analyst Forecast
Analyst Consensus: Trip.com enjoys a "Strong Buy" average rating from analysts, reflecting a bullish outlook on the stock. The consensus 12-month price target stands at $50.4, indicating a substantial upside potential of 36.22% from its recent tradin

TCOM testing significant resistance Trip.com (TCOM) presently testing significant long-term resistance, able to contain monthly buying pressures. From here, sellers can gain control and (TCOM) can fall back to support, eliciting losses of 20% over the following 2 - 3 months. Inversely, a weekly settlement above this long-term resistan

See all ideas
Summarizing what the indicators are suggesting.
Neutral
SellBuy
Strong sellStrong buy
Strong sellSellNeutralBuyStrong buy
Neutral
SellBuy
Strong sellStrong buy
Strong sellSellNeutralBuyStrong buy
Neutral
SellBuy
Strong sellStrong buy
Strong sellSellNeutralBuyStrong buy
An aggregate view of professional's ratings.
Neutral
SellBuy
Strong sellStrong buy
Strong sellSellNeutralBuyStrong buy
Neutral
SellBuy
Strong sellStrong buy
Strong sellSellNeutralBuyStrong buy
Neutral
SellBuy
Strong sellStrong buy
Strong sellSellNeutralBuyStrong buy
Displays a symbol's price movements over previous years to identify recurring trends.
CTRP6098062
Trip.com Group Limited 0.75% 15-JUN-2029Yield to maturity
—
Maturity date
Jun 15, 2029
CTRP5015202
Trip.com Group Limited 1.5% 01-JUL-2027Yield to maturity
—
Maturity date
Jul 1, 2027
See all 9961 bonds
Curated watchlists where 9961 is featured.

Frequently Asked Questions
The current price of 9961 is 554.0 HKD — it has decreased by −4.00% in the past 24 hours. Watch Trip.com Group Ltd. stock price performance more closely on the chart.
Depending on the exchange, the stock ticker may vary. For instance, on HKEX exchange Trip.com Group Ltd. stocks are traded under the ticker 9961.
9961 stock has fallen by −4.67% compared to the previous week, the month change is a −0.63% fall, over the last year Trip.com Group Ltd. has showed a 11.74% increase.
We've gathered analysts' opinions on Trip.com Group Ltd. future price: according to them, 9961 price has a max estimate of 750.00 HKD and a min estimate of 608.00 HKD. Watch 9961 chart and read a more detailed Trip.com Group Ltd. stock forecast: see what analysts think of Trip.com Group Ltd. and suggest that you do with its stocks.
9961 reached its all-time high on Sep 19, 2025 with the price of 613.0 HKD, and its all-time low was 123.5 HKD and was reached on Mar 15, 2022. View more price dynamics on 9961 chart.
See other stocks reaching their highest and lowest prices.
See other stocks reaching their highest and lowest prices.
9961 stock is 4.55% volatile and has beta coefficient of 1.04. Track Trip.com Group Ltd. stock price on the chart and check out the list of the most volatile stocks — is Trip.com Group Ltd. there?
Today Trip.com Group Ltd. has the market capitalization of 375.30 B, it has increased by 6.04% over the last week.
Yes, you can track Trip.com Group Ltd. financials in yearly and quarterly reports right on TradingView.
Trip.com Group Ltd. is going to release the next earnings report on Mar 25, 2026. Keep track of upcoming events with our Earnings Calendar.
9961 earnings for the last quarter are 30.16 HKD per share, whereas the estimation was 8.76 HKD resulting in a 244.14% surprise. The estimated earnings for the next quarter are 5.13 HKD per share. See more details about Trip.com Group Ltd. earnings.
Trip.com Group Ltd. revenue for the last quarter amounts to 20.07 B HKD, despite the estimated figure of 19.87 B HKD. In the next quarter, revenue is expected to reach 16.26 B HKD.
9961 net income for the last quarter is 21.73 B HKD, while the quarter before that showed 5.23 B HKD of net income which accounts for 315.61% change. Track more Trip.com Group Ltd. financial stats to get the full picture.
Yes, 9961 dividends are paid annually. The last dividend per share was 2.33 HKD. As of today, Dividend Yield (TTM)% is 0.41%. Tracking Trip.com Group Ltd. dividends might help you take more informed decisions.
Trip.com Group Ltd. dividend yield was 0.43% in 2024, and payout ratio reached 8.68%. The year before the numbers were 0.00% and 0.00% correspondingly. See high-dividend stocks and find more opportunities for your portfolio.
As of Nov 21, 2025, the company has 41.07 K employees. See our rating of the largest employees — is Trip.com Group Ltd. on this list?
EBITDA measures a company's operating performance, its growth signifies an improvement in the efficiency of a company. Trip.com Group Ltd. EBITDA is 17.73 B HKD, and current EBITDA margin is 28.68%. See more stats in Trip.com Group Ltd. financial statements.
Like other stocks, 9961 shares are traded on stock exchanges, e.g. Nasdaq, Nyse, Euronext, and the easiest way to buy them is through an online stock broker. To do this, you need to open an account and follow a broker's procedures, then start trading. You can trade Trip.com Group Ltd. stock right from TradingView charts — choose your broker and connect to your account.
Investing in stocks requires a comprehensive research: you should carefully study all the available data, e.g. company's financials, related news, and its technical analysis. So Trip.com Group Ltd. technincal analysis shows the sell today, and its 1 week rating is buy. Since market conditions are prone to changes, it's worth looking a bit further into the future — according to the 1 month rating Trip.com Group Ltd. stock shows the buy signal. See more of Trip.com Group Ltd. technicals for a more comprehensive analysis.
If you're still not sure, try looking for inspiration in our curated watchlists.
If you're still not sure, try looking for inspiration in our curated watchlists.