HELIUM 4 hr hidden bull divHeres another idea .....
this time Helium on the 4 hr chart, it caught my eye as this is one of the coins with the 4 hr stoch rsi low,
Hidden Bull Div gives some probability to the upside.
Looks to me like a V shape recovery Adam and Eve played out.
It has already ripped through the 200 SMA and now in a bull flag.
Could it be a huge cup and now in the handle for a huge pump, or was the cup and handy before the pump through the 200 SMA.
The golden cross zipped through and price action responded.
Measured move upto 2.2 range with a bit of resistance around 1.9
Moving averages look like they want to curl up nicely
Money flow does look a little bearish with it moving down but could flip,
4 hour rsi wants to rip in my opinion :)
Peace and love everyone :)
Market insights

HNT is successfully recovering! +50% in the near future.Hello everyone! A month ago, I wrote my idea about HNT, but the delisting with Binance caused a drop in the coin's price.
However, as I mentioned in the comments on my previous idea, the project is old and has a strong team and goals they are achieving.
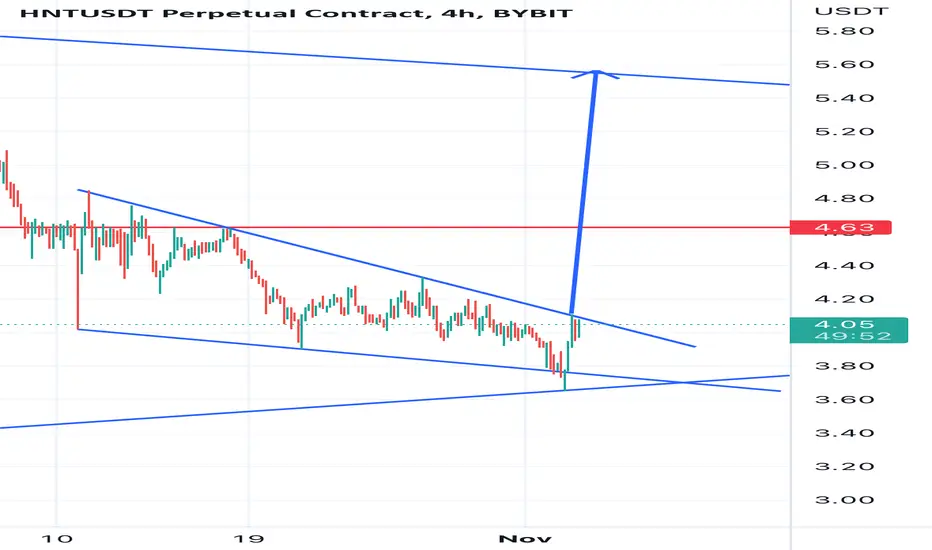
Currently, the asset has recovered from the fall and in a local picture on the chart, it has formed a technical analysis figure of an ascending triangle, successfully breaking the Fibonacci resistance level of 0.236 and consolidating above it.
If we look at it from a wider perspective, the asset is moving in a descending channel. The correction of the asset occurred to the lower boundary of the channel, and a reversal movement has started.
I expect the asset to recover to the Fibonacci level of 0.382 with further breaking of the level and a rise in price to the Fibonacci level of 0.618 ($2.28).
It is possible to expect the asset to retrace to the Fibonacci level of 0.236 and take a position in this area.
Targets on the chart.
This is not a financial recommendation, and everything you do is done at your own risk.


$HNT/USDT comebackAfter $HNT delisted from Binance I will be waiting for a coom back by on $HNT.
If trendline breakes I will be waiting a pump till $2.519.
Not financial advice DOYR.

Hntusdt Helum(hnt) need to fight with 1.30$ line to comeback to 1.50$ . If hnt can't hold itself above 1.30zone it may see 1$ again

HNTUSDT BULLUSH TRENDHNTUSDT showing a bullish trend as a series of higher highs and higher lows noticed in 1 hour time frame since 13 feb 2023.

HNTXUSDT future for 5%/50% Absolute X3My recommended trades are based only on the uptrend of the market. It will be opened in the time frame of 1 hour and at the end of the day, profit trading will be closed with any amount of profit. And only losing trades will remain open until they are liquidated. This trading strategy is backtested and works only in an uptrend.

🔔HNTUSDT🔔After a sharp growth and the breaking of the ascending channel, it has formed a flag pattern and is preparing for the next move...
WOMAN , LIFE , FREEDOM

HNT ANALYSIShi good time
It can have a middle correction to the announcement area and then move to higher areas. Don't forget capital management, stop, leverage and leverage
Comment if you have any questions
Thank You

HNTIdea: The price moves in a falling channel. The price retested the nearest strong support level, but failed to gain a foothold above it. A rebound from the resistance level will be a signal to continue the fall. The breakdown of the upper border of the channel will start a strong local uptrend

HNT/USDT Double Bottom? Hey, traders
HNT coin will be last one for today! Well we see one thing on 4hr chart which is "Double Bottom" pattern - bullish sign for pattern hunters but also we see that indicators are not turned bullish yet so we are not looking into any buys until we break that EMA100 zone at least and secure it on 4hr chart.
Overall we are still in bearish trend and if we break that line on HNT coin we might have a very nasty drop. Any thoughts guys?
If you like ideas provided by our team you can show us your support by liking and commenting.
Yours Sincerely,
Swallow Team 🔱
Disclamer:
We are not financial advisors. The content that we share on this website are for educational purposes and are our own personal opinions.


HntbusdHnt is in a consolidation on 4hr time frame called parallel channel that indicate a reversal trend + strong support + wave E on a higher timeframe
HNTUSDT Great Buy Zone. Check It OutHNT has had a great retracement. I do believe this is a great Buy zone, But lets not get too excited. How about allocating 1/2 a position size until we get some more clarity. Not telling anyone to do anything just publishing personal idea.

$HNT $6 seems likelya breakout seems near approaching the downwards trendline, and there seems to be a lot of confluence near $6.

More downward movement for HNT?Notice of Removal of Trading Pairs - 2022-10-14
Binance will remove and cease trading on the following trading pairs at 2022-10-12 03:00 (UTC): Cross & Isolated Margin Pairs: HNT/BUSD, HNT/USDT
Binance will remove and cease trading on the following trading pairs at 2022-10-14 03:00 (UTC): Spot Pairs: HNT/BTC, HNT/USDT, OOKI/BNB
Please note: Users can still trade the above assets on other trading pairs that are available on Binance.
At 2022-10-07 03:00 (UTC), Binance will suspend HNT/BUSD and HNT/USDT cross and isolated margin borrowing.
At 2022-10-12 03:00 (UTC), Binance will close users’ positions, conduct an automatic settlement and cancel all pending orders on the HNT/BUSD and HNT/USDT cross and isolated margin pairs. We will then delist the HNT/BUSD and HNT/USDT cross and isolated margin pairs. Users are strongly advised to close their positions prior to the cessation of margin trading to avoid any potential losses.
I am already in a short position, and will continue to hold through to next week

2-23-Archive for learningMarket started to rise but it could be fake! BTC and USDT.D have broken there resistances but Total2 doesn't, and HNT has crossed 34EMA witch it is a long singe for me.
Hope this time I haven't made a mistake!

2-17-Archive for learningIt looks like market is going to fall! and this coin is good for short because it doesn't have support line.

Long HNTIt seems like HNT is at the bottom of a Wave 5 correction with momentum showing an Inverse H&S. This is telling me that we'll have a Wave A bounce up to these fib levels. My minimum TP is the first fibonacci level at the 0.382. RSI is also showing bullish divergence, so I expect HNT to pop while Bitcoin consolidates.
This chart based off of The Elliot Wave Theory, Fibonacci, EMA’s, MacD , RSI , Momentum, and resistance/support zones combined with patterns.

H4 TA analysis of the current situation with two options ahead Daily:
We have a not clear downtrend, almost empty area below 8.50. Next serious support is 7.40
H4:
Downtrend for 5 days (-23%), accumulation for 13 days with further bearish breakout. At 8.6 - new accumulation.
After false breakout, no high correction, 3rd bar after FB is "stop bar". Next bar in bearish. reached 80% H4 ATR for 3 hours.
It seems that shorts are nearby, but we have to be sure, that other scenario is cancelled. The best short signal for us will be small bars (H1-H4) in yellow box, just above the 8.5 line.
Tp is 3-5% above the 7.40

Closing HNT position @ 9.07Closing this trade at 6% profit. This was a scalp trade. I'm reorganizing my portfolios for todays market open.

Short @ 9.25 x3 Leverage Open Stop LossAlso loosing it's momentum, opening up a position I may add on to, see chart before this. 6/9/22

