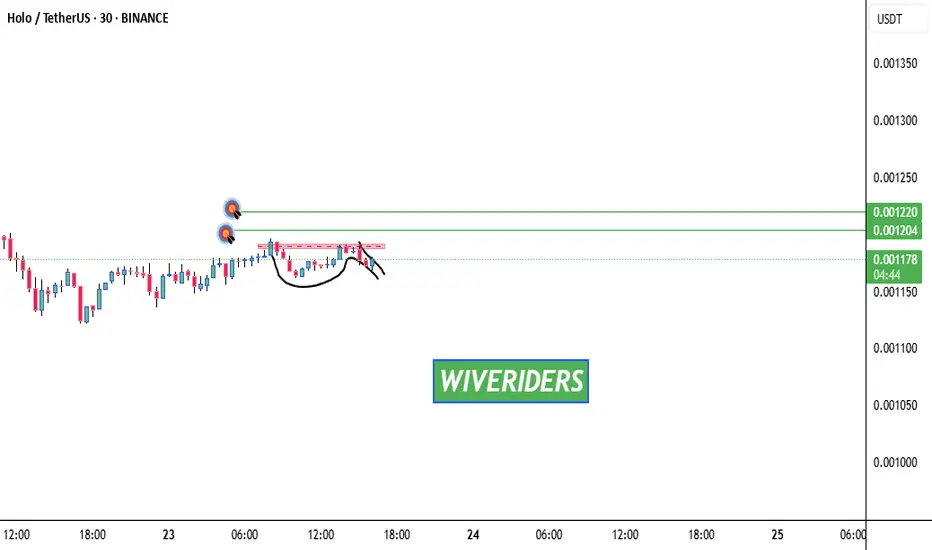
Cup & Handle Formation 🚨 XETR:HOT Testing Red Resistance – Cup & Handle Formation 📈
XETR:HOT is currently testing the red resistance zone and has formed a bullish Cup & Handle pattern on the chart — a classic continuation setup.
If breakout is confirmed, potential upside:
✅ First Target: Green line level
✅ Second Target: Green line level
🕵️♂️ Wait for clear breakout confirmation before entering long.
This pattern often signals strong momentum if buyers step in.
Trade smart. Let’s monitor for the perfect entry! 💹💼
HOTUSDT.P trade ideas
#HOT/USDT#HOT
The price is moving within a descending channel on the 1-hour frame, adhering well to it, and is heading for a strong breakout and retest.
We are seeing a bounce from the lower boundary of the descending channel, which is support at 0.000840.
We have a downtrend on the RSI indicator that is about to be broken and retested, supporting the upward trend.
We are looking for stability above the 100 moving average.
Entry price: 0.000852
First target: 0.000862
Second target: 0.000875
Third target: 0.000890

HOT/USDT Breakout Confirmation or Bull Trap? Critical Retest!🧠 In-Depth Technical Breakdown (Daily Timeframe):
HOT/USDT (Holo vs Tether) is currently at a crucial inflection point, following a confirmed breakout from a long-standing downtrend. The price is now retesting a major demand zone, and how it reacts here will determine its next big move.
Let’s dive deeper into the technical structure, chart patterns, and the possible bullish and bearish scenarios:
---
🔻 1. Trend Structure & Major Breakout
Since peaking in late December 2024, HOT/USDT was trapped in a descending trendline (yellow diagonal line).
In mid-July 2025, price successfully broke above this downtrend, signaling a potential trend reversal.
This breakout suggests a shift in market sentiment from bearish to neutral-to-bullish.
---
🟨 2. Retesting the Key Demand Zone (Support Flip)
Price is currently testing a critical demand/support zone between 0.00090 – 0.00110 USDT (highlighted in the yellow box).
This area served as a major consolidation base in the past and is now being tested as support after the breakout.
A successful retest will validate the breakout and could spark a continuation to the upside.
---
📐 3. Chart Pattern: Falling Wedge Breakout
Price action clearly formed a Falling Wedge pattern, typically a bullish reversal setup.
The breakout from the wedge confirms bullish momentum and the potential start of a new trend.
---
🔮 4. Price Scenarios Moving Forward
✅ Bullish Scenario:
If the price holds above the 0.00090–0.00100 zone:
1. Potential upside targets:
TP1: 0.00134 (minor resistance)
TP2: 0.00147 (key structural level)
TP3: 0.00159 (breakout continuation zone)
TP4: 0.00229 – 0.00246 (historical range highs)
TP5: 0.00380 – 0.00407 (major highs from previous cycle)
2. This structure could mark the beginning of a higher low + higher high uptrend, if confirmed.
❌ Bearish Scenario:
If the price breaks below 0.00090 with strong volume:
1. Likely a return to previous support at:
0.00072 USDT (historical low and major support level).
2. This would invalidate the breakout and possibly confirm a bull trap, resuming the downtrend.
---
🧩 Other Key Technical Notes (Not Shown in Chart but Useful):
Volume: Look for high volume on the breakout and retest to confirm validity.
RSI/Divergence: Check for hidden or bullish divergence on the last swing low.
EMA 50/200: If price crosses or holds above these EMAs, it adds further confirmation of trend reversal.
---
📊 Summary & Trading Strategy:
HOT/USDT is in a critical phase of retesting a major breakout, offering traders a great opportunity to either buy the dip or wait for confirmation.
Suggested Strategy:
Conservative Entry: Wait for a bullish candle close above 0.00100 with strong rejection from the support zone.
Aggressive Entry: Buy near 0.00090–0.00100 with a tight stop loss below 0.00087.
Use resistance levels for scaling out profits or setting targets.
#HOTUSDT #HoloToken #AltcoinAnalysis #CryptoBreakout #TechnicalAnalysis #ChartPattern #BullishReversal #FallingWedge #SupportZone #CryptoTA

#HOT/USDT#HOT
The price is moving within a descending channel on the 1-hour frame, adhering well to it, and is heading for a strong breakout and retest.
We are experiencing a rebound from the lower boundary of the descending channel. This support is at 000873.
We are experiencing a downtrend on the RSI indicator, which is about to break and retest, supporting the upward trend.
We are in a trend of consolidation above the 100 moving average.
Entry price: 0.000888
First target: 0.000910
Second target: 0.000933
Third target: 0.000958

#HOT/USDT#HOT
The price is moving within a descending channel on the 1-hour frame and is expected to break and continue upward.
We have a trend to stabilize above the 100 moving average once again.
We have a downtrend on the RSI indicator that supports the upward move with a breakout.
We have a support area at the lower boundary of the channel at 0.000945, acting as strong support from which the price can rebound.
Entry price: 0.000948
First target: 0.000984
Second target: 0.000998
Third target: 0.001020

HOTUSDT 1W AnalysisHOT ~ 1W Analysis
#HOT Buy gradually from here if you still have confidence in this coin with a short term target of at least 20%+ from this support block.

#HOT/USDT#HOT
The price is moving within a descending channel on the 1-hour frame, adhering well to it, and is heading for a strong breakout and retest.
We are seeing a bounce from the lower boundary of the descending channel, which is support at 0.001240.
We have a downtrend on the RSI indicator that is about to be broken and retested, supporting the upward trend.
We are looking for stability above the 100 moving average.
Entry price: 0.001346
First target: 0.001415
Second target: 0.001500
Third target: 0.001607

#HOT/USDT#HOT
The price is moving within a descending channel on the 1-hour frame, adhering well to it, and is on its way to breaking it strongly upwards and retesting it.
We are seeing a bounce from the lower boundary of the descending channel, this support at 0.01018.
We have a downtrend on the RSI indicator that is about to break and retest, supporting the upward trend.
We are looking for stability above the 100 moving average.
Entry price: 0.01086
First target: 0.001118
Second target: 0.001155
Third target: 0.001200

HOTUSDT Analysis D1HOTUSDT Horizontal Resistance Breakout & Retest Confirmed, Now Holochain Need To Break Descending Channel To Lead Solid Recovery, Expecting 150% Rally After Successful Breakout

HOTUSDT 1D AnalysisHOT ~ 1D Analysis
#HOT Buy after successfully penetrating this resistant line with a short -term target of at least 10%+ from here.

HOTUSDT clusters What we have in this point
"We are at a strong support area on the higher timeframes, with a demand zone.
A Butterfly harmonic pattern has appeared, and a breakout from the descending channel occurred.
This situation calls for making a decision now and then patiently waiting for the targets to be achieved."

HOTUSDT 1WHOT ~ 1W Analysis
#HOT Buy gradually from here if you still have a Conviction on this coin with a short -term target of at least 20%+.

#HOT/USDT#HOT
The price is moving in a descending channel on the 1-hour frame and is adhering to it well and is heading to break it strongly upwards and retest it
We have a bounce from the lower limit of the descending channel, this support is at a price of 0.001065
We have a downtrend on the RSI indicator that is about to break and retest, which supports the rise
We have a trend to stabilize above the moving average 100
Entry price 0.001148
First target 0.001194
Second target 0.0001255
Third target 0.001320

HOTUSDT 4H#HOT has accumulated in the box on the 4H timeframe and is on the verge of breaking out above the Ichimoku cloud and the trendline. Targets are:
🎯 $0.001725
🎯 $0.001813
🎯 $0.001900
🎯 $0.002025
🎯 $0.002184

HOTUSDT 1WHOT ~ 1W Analysis
#HOT This support has been maintained so far. Buy from here if you still have a Conviction on this coin with a minimum target of 20%+

Good for Long termHolo is a peer-to-peer distributed platform for hosting decentralized applications built using Holochain, a framework for developing DApps that does not require the use of blockchain technology. The goal of Holo is to serve as a bridge between the broader internet and apps built using Holochain, offering an ecosystem and marketplace in which DApps are easily accessible, as they are hosted on the internet by Holo network participants.

HOT/USDT – Is a Major Reversal Incoming?Yello, Paradisers! Is HOTUSDT About to Explode, or Are We Heading for a Breakdown? Are we looking at a massive breakout, or is a deeper drop lurking just around the corner? This setup is screaming opportunity, but only for those who know how to play it right.
💎#HOTUSDT has been stuck in a clear downtrend, moving within a descending channel for weeks. But now, the price has reached a critical support zone a level that has historically acted as a launchpad for strong reversals. The big question is whether this level will hold or if sellers will push for another leg down.
💎The key support level to watch is around $0.001421. If bulls manage to sustain momentum here, there is a high probability of a bullish continuation, with price targeting a strong rally toward $0.002736, which has been a major resistance level in the past. However, if momentum fades, the next significant support zone to watch is $0.001090. A break below this level would invalidate the bullish scenario and could open the door for further downside.
💎 This is a make-or-break moment for $HOT. The market is at a decision point, and patience is crucial. If the support holds, this could present a high-probability long opportunity. But if it fails, stepping aside and waiting for lower entries will be the smartest move. Discipline and a well-executed strategy will determine who profits and who gets liquidated.
Stay sharp, Paradisers! The market doesn’t forgive emotional decisions stick to the plan and execute like a pro!
MyCryptoParadise
iFeel the success🌴

#HOT/USDT#HOT
The price is moving in a descending channel on the 1-hour frame and is expected to continue upwards
We have a trend to stabilize above the moving average 100 again
We have a descending trend on the RSI indicator that supports the rise by breaking it upwards
We have a support area at the lower limit of the channel at a price of 0.001950
Entry price 0.002000
First target 0.002107
Second target 0.002210
Third target 0.002346

Trading opportunity for HOTUSDTBased on technical factors there is a Buy position in :
📊 HOTUSDT
🔵 Buy Now
🪫Stop loss 0.001800
🔋Target 0.002500
📏 R/R 3
💸RISK : 1%
We hope it is profitable for you ❤️
Please support our activity with your likes👍 and comments📝

Holochain targets for this yearPossible Targets and explanation idea
➡️Cuz all noise and open Weekly chart. Trader over 330 days in sideways in -0.27 zone
➡️-0.27 zone always play out like accumulation zones. Higher timeframe more important zone
➡️Trade under fundamental price (real value) based on Take profit indicator.
➡️Take profit now at 0 level by fib 0.0082 where we will see rejection for the first time
➡️All lines are dynamic.
Hope you enjoyed the content I created, You can support with your likes and comments this idea so more people can watch!
✅Disclaimer: Please be aware of the risks involved in trading. This idea was made for educational purposes only not for financial Investment Purposes.
---
• Look at my ideas about interesting altcoins in the related section down below ↓
• For more ideas please hit "Like" and "Follow"!

HOT Long BiasHOT is looking interesting for another leg up, with bullish RSI divergence on the lows, and no divergence on the higher high (1 or A).
For long trades, I see an aggressive and a conservative stop loss level, depending on your trading style.
Targets can be placed on resistance levels along the way, shown in yellow.

#HOLO #HOT #HOLOTOKEN #ETHEREUM ECOSYSTEMLet's watch and see if recurring historical dynamics occur.
15 February 2021' vs 15 February 2025 ..
#HOLO #HOT #HOLOTOKEN #ETHEREUM ECOSYSTEM

HOTUSDT UPDATEHOTUSDT is a cryptocurrency trading at $0.002318. Its target price is $0.003400, indicating a potential 50%+ gain. The pattern is a Bullish Falling Wedge, a reversal pattern signaling a trend change. This pattern suggests the downward trend may be ending. A breakout from the wedge could lead to a strong upward move. The Bullish Falling Wedge is a positive signal, indicating a potential price surge. Investors are optimistic about HOTUSDT's future performance. The current price may be a buying opportunity. Reaching the target price would result in significant returns. HOTUSDT is poised for a potential breakout.
