SUGAR WEDGEPrice has made a wedge pattern. daily has broken the trend line and conducting pullback. Also notice outside day on weekly @ demand
Sugar No. 16 Futures
No trades
Market insights

SB1! Futures Chart- Sugar id front of a great resistance which fights to break it. for the moment it is in a bearish phase if it doesnt break the level of (11) with power
- For the moment there is a very high probability that the market will return to test the level of (9.60) . which is going to be an important
support.
- And if ever it breack it there is an 80% probability that the market will move to (8.36)

COT - Sugar 11 - LongComments: this play can be rushed, because the levels of both cot indexes we monitor are still low. We want anyway to enter because:
- the speed of the drop was very fast (price % change / time of the change in weeks)
- net position change speed was very fast (net position % change / time of the change in weeks)
- for the very good r/r at this price level
Cot 3y: 51.8
Cot 6m: 51.8
Rsi: bullish divergence
Price: multiyear support
Entry: 10.43

Sugar buy or sellWe can open short positions if the support breaks and the price comes back for a retracement. In the alternative scenario, we can open long positions if we see reversal signs.


SUGAR FUTURES (SB1!) DailyDates in the future with the greatest probability for a price high or price low.
The Djinn Predictive Indicators are simple mathematical equations. Once an equation is given to Siri the algorithm provides the future price swing date. Djinn Indicators work on all charts, for any asset category and in all time frames. Occasionally a Djinn Predictive Indicator will miss its prediction date by one candlestick. If multiple Djinn prediction dates are missed and are plowed through by same color Henikin Ashi candles the asset is being "reset". The "reset" is complete when Henikin Ashi candles are back in sync with Djinn price high or low prediction dates.
One way the Djinn Indicator is used to enter and exit trades:
For best results trade in the direction of the trend.
The Linear Regression channel is used to determine trend direction. The Linear Regression is set at 2 -2 30.
When a green Henikin Ashi candle intersects with the linear regression upper deviation line (green line) and both indicators intersect with a Djinn prediction date a sell is triggered.
When a red Henikin Ashi candle intersects with the linear regression lower deviation line (red line) and both indicators intersect with a Djinn prediction date a buy is triggered.
This trading strategy works on daily, weekly and Monthly Djinn Predictive charts.
This is not trading advice. Trade at your own risk.

SUGAR FUTURES (SB1!) WeeklyDates in the future with the greatest probability for a price high or price low.
The Djinn Predictive Indicators are simple mathematical equations. Once an equation is given to Siri the algorithm provides the future price swing date. Djinn Indicators work on all charts, for any asset category and in all time frames. Occasionally a Djinn Predictive Indicator will miss its prediction date by one candlestick. If multiple Djinn prediction dates are missed and are plowed through by same color Henikin Ashi candles the asset is being "reset". The "reset" is complete when Henikin Ashi candles are back in sync with Djinn price high or low prediction dates.
One way the Djinn Indicator is used to enter and exit trades:
For best results trade in the direction of the trend.
The Linear Regression channel is used to determine trend direction. The Linear Regression is set at 2 -2 30.
When a green Henikin Ashi candle intersects with the linear regression upper deviation line (green line) and both indicators intersect with a Djinn prediction date a sell is triggered.
When a red Henikin Ashi candle intersects with the linear regression lower deviation line (red line) and both indicators intersect with a Djinn prediction date a buy is triggered.
This trading strategy works on daily, weekly and Monthly Djinn Predictive charts.
This is not trading advice. Trade at your own risk.

SUGAR FUTURES (SB1!) MonthlyDates in the future with the greatest probability for a price high or price low.
The Djinn Predictive Indicators are simple mathematical equations. Once an equation is given to Siri the algorithm provides the future price swing date. Djinn Indicators work on all charts, for any asset category and in all time frames. Occasionally a Djinn Predictive Indicator will miss its prediction date by one candlestick. If multiple Djinn prediction dates are missed and are plowed through by same color Henikin Ashi candles the asset is being "reset". The "reset" is complete when Henikin Ashi candles are back in sync with Djinn price high or low prediction dates.
One way the Djinn Indicator is used to enter and exit trades:
For best results trade in the direction of the trend.
The Linear Regression channel is used to determine trend direction. The Linear Regression is set at 2 -2 30.
When a green Henikin Ashi candle intersects with the linear regression upper deviation line (green line) and both indicators intersect with a Djinn prediction date a sell is triggered.
When a red Henikin Ashi candle intersects with the linear regression lower deviation line (red line) and both indicators intersect with a Djinn prediction date a buy is triggered.
This trading strategy works on daily, weekly and Monthly Djinn Predictive charts.
This is not trading advice. Trade at your own risk.


COT, SHORT SUGAR 16.49 Entry on multi year down trend
If resistence is broken possible downtrend continuation for huge R/R
First target around 10%
In several weeks COT index at 156 weeks should go to zero

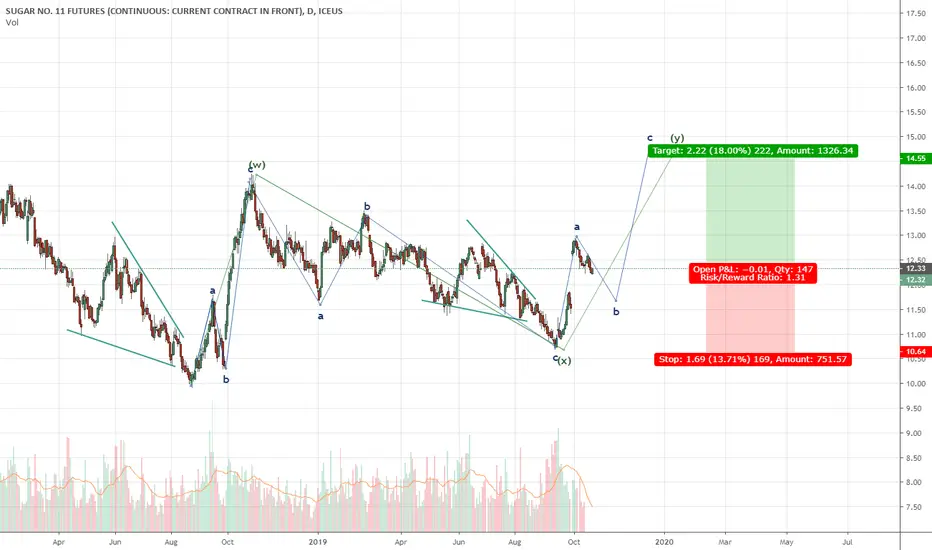
Sugar Futures long by Elliott Wave Theory.All description on the chart.
Please, don't forget to like and follow.
Thank you.

Sugar great idea with Eliott wavesYou can see Eliott waves on sugar chart, also C wave started
Let me tell you next:
I have read from several sources that sugar production in the world has declined so this can raise prices.
Price has already hit a strong resistance. it will probably be broken.
After price confirm you can enter long position I enter earlier!
For TP we have 2 target. the first one is the 50% Fibonacci level and the second one is 61%.
about the chart, if you have questions ask me in the comment I will answer you.
Have a nice weekend

Sugar Futures (SB1!) long.All description on the chart.
Please, don't forget to like and follow.
Thank you.

Sweet squeeze canditate after breakaway gapCommercials started reducing their longs in HL $CANE, $SB_F

Sugar #11(NYBOT)-Mar. tend to be weak betw. 2 Nov. and 9 Dec.Sugar #11(NYBOT)-Mar. contract
Sell on approximately 11/02 - Exit on approximately 12/09
Percentage Correct: 87
Average Profit on Winning Trades: 0.89
Average Profit Amount on Winning Trades: $1001.97
Number of Winners: 13 out of 15
Average Loss on Trades: -1.10
Average Loss Amount on Losing Trades: -1232.00
Average Net Profit Per Trade 0.63
Average Net Profit Per Trade 704.11
SEASONAL TENDENCIES ARE A COMPOSITE OF SOME OF THE MORE CONSISTENT COMMODITY FUTURES SEASONALS THAT HAVE OCCURRED OVER THE PAST 15 YEARS. THERE ARE USUALLY UNDERLYING FUNDAMENTAL CIRCUMSTANCES THAT OCCUR ANNUALLY THAT TEND TO CAUSE THE FUTURES MARKETS TO REACT IN A SIMILAR DIRECTIONAL MANNER DURING A CERTAIN CALENDAR PERIOD OF THE YEAR. EVEN IF A SEASONAL TENDENCY OCCURS IN THE FUTURE, IT MAY NOT RESULT IN A PROFITABLE TRANSACTION AS FEES, AND THE TIMING OF THE ENTRY AND LIQUIDATION MAY IMPACT ON THE RESULTS. NO REPRESENTATION IS BEING MADE THAT ANY ACCOUNT HAS IN THE PAST OR WILL IN THE FUTURE ACHIEVE PROFITS UTILIZING THESE STRATEGIES. NO REPRESENTATION IS BEING MADE THAT PRICE PATTERNS WILL RECUR IN THE FUTURE. HYPOTHETICAL PERFORMANCE RESULTS HAVE MANY INHERENT LIMITATIONS, SOME OF WHICH ARE DESCRIBED BELOW. NO REPRESENTATION IS BEING MADE THAT ANY ACCOUNT WILL OR IS LIKELY TO ACHIEVE PROFITS OR LOSSES SIMILAR TO THOSE SHOWN. IN FACT, THERE ARE FREQUENTLY SHARP DIFFERENCES BETWEEN HYPOTHETICAL PERFORMANCE RESULTS AND THE ACTUAL RESULTS SUBSEQUENTLY ACHIEVED BY ANY PARTICULAR TRADING PROGRAM. ONE OF THE LIMITATIONS OF HYPOTHETICAL PERFORMANCE RESULTS IS THAT THEY ARE GENERALLY PREPARED WITH THE BENEFIT OF HINDSIGHT. IN ADDITION, HYPOTHETICAL TRADING DOES NOT INVOLVE FINANCIAL RISK, AND NO HYPOTHETICAL TRADING RECORD CAN COMPLETELY ACCOUNT FOR THE IMPACT OF FINANCIAL RISK IN ACTUAL TRADING. FOR EXAMPLE, THE ABILITY TO WITHSTAND LOSSES OR ADHERE TO A PARTICULAR TRADING PROGRAM IN SPITE OF TRADING LOSSES ARE MATERIAL POINTS WHICH CAN ALSO ADVERSELY AFFECT ACTUAL TRADING RESULTS. THERE ARE NUMEROUS OTHER FACTORS RELATED TO THE MARKETS IN GENERAL OR TO THE IMPLEMENTATION OF ANY SPECIFIC TRADING PROGRAM WHICH CANNOT BE FULLY ACCOUNTED FOR IN THE PREPARATION OF HYPOTHETICAL PERFORMANCE RESULTS AND ALL OF WHICH CAN ADVERSELY AFFECT ACTUAL TRADING RESULTS. RESULTS NOT ADJUSTED FOR COMMISSION AND SLIPPAGE.


Reasonable Sugar Long TimestampJust sharing my bet; 50-50 chance of working out but the R:R is greater than 1:1, thus, a good trade

Sugar: Buy Opportunity with an end-of-year horizon.Sugar has been trading within a 1M Channel Down for almost 1 full year (RSI = 40.519, MACD = -0.770, Highs/Lows = -0.1543). It is close to pricing a Lower Low, turning the current levels into a buy opportunity. Our Target Zone is 11.65 - 11.90.
** If you like our free content follow our profile (www.tradingview.com) to get more daily ideas. **
Comments and likes are greatly appreciated.

Early call on sugarYes, it might be early, and yes sugar might go down a little bit more, but I think an uptrend is at hand.
1. There's a strong seasonal uptrend September, October
2. Commercials got a big long position, 105.904 contracts, which is actually 93,91% relative for the past 6 months.
3. Open Interest is mainly driven by Commercials (988.550 total contracts), Large Specs are the smaller player (581.399
total contracts) right now, so Commercials' long position should win the upper hand.
4. Technical, %R is oversold
5. Technical, ADX suggests a rather weak downtrend
6. It's heavily undervalued compared to gold (orange line)
We got 6 of our Axioms flashing bullish, so I bought SBH20 to make sure I'm in when the expected uptrend starts. I'm not in the business of chasing markets which are already on the run.
Disclaimer:
Trading and investing involves a substantial rik of loss.
Our recommendations are of opinion only and do not guarantee an profits. Past performances are not indicative of future results.
If you decide to invest or trade, all dcisions are your own.


