US30 Consolidation downtrend may continueUS30 is trading within a well-defined ascending channel, clearly showing a strong bullish trend Price action has respected both the upper resistance line and lower support line of the channel, confirming healthy trend structure with higher highs and higher lows.
Currently, price is trading near the upper half of the channel, around the 48,600–48,800 zone, which is acting as a short-term resistance area. This region has previously triggered selling pressure, making it a key decision point for the market.
Technically Price may face rejection near the upper channel resistance and move lower for a healthy correction toward the mid-channel area near 48,200, and potentially the lower channel support around 47,500 if selling pressure increases and the lower channel support breaks, price could accelerate toward 47,500 or below, signalling a temporary weakness before the trend resumes or consolidates.
the trend remains bullish, but the market looks overextended in the short term. A pullback or consolidation is expected before any further upside continuation. Traders should watch 48,800 as resistance and 47,500 as major support for the next directional move.
You may find more details in the chart,
Trade wisely best of luck buddies.
Ps; Support with like and comments for better analysis thanks for supporting.
Market insights

US30 H1 | Bullish ContinuationMomentum: Bullish
Price is currently above the ichimoku cloud.
Buy entry: 48,426.11
- Overlap support
- 38.2% Fib retracement
Stop Loss: 48,229.27
- Overlap support
Take Profit: 48,687.99
- Swing high resistance
- 100% Fib projection
High Risk Investment Warning
Stratos Markets Limited (tradu.com/uk ), Stratos Europe Ltd (tradu.com/eu ):
CFDs are complex instruments and come with a high risk of losing money rapidly due to leverage. 70% of retail investor accounts lose money when trading CFDs with this provider. You should consider whether you understand how CFDs work and whether you can afford to take the high risk of losing your money.
Stratos Global LLC (tradu.com/en ): Losses can exceed deposits.
Please be advised that the information presented on TradingView is provided to Tradu (‘Company’, ‘we’) by a third-party provider (‘TFA Global Pte Ltd’). Please be reminded that you are solely responsible for the trading decisions on your account. Any information and/or content is intended entirely for research, educational and informational purposes only and does not constitute investment or consultation advice or investment strategy. The information is not tailored to the investment needs of any specific person and therefore does not involve a consideration of any of the investment objectives, financial situation or needs of any viewer that may receive it. Past performance is not a reliable indicator of future results. Actual results may differ materially from those anticipated in forward-looking or past performance statements. We assume no liability as to the accuracy or completeness of any of the information and/or content provided herein and the Company cannot be held responsible for any omission, mistake nor for any loss or damage including without limitation to any loss of profit which may arise from reliance on any information supplied by TFA Global Pte Ltd.

US30 Approaches Key Support at 48,400!Hey Traders,
In the coming week, we are monitoring US30 (Dow Jones) for a potential buying opportunity around the 48,400 zone.
The index remains in a well-defined uptrend and is currently undergoing a healthy corrective pullback. Price is now approaching a key trend support and support/resistance confluence near 48,400, an area that has previously attracted buyers.
If bullish structure remains intact, this zone could act as a base for trend continuation higher. Watching closely for price reaction and confirmation before engaging.
Trade safe,
Joe

Look Bullish Looking Bullish. I love the fact that on the 30 minute timeframe the moving averages are flowing very nicely below the market. Acting as a strong level of support. Four hour timeframe just create a level of support as well which definitely looks good for a continuation of the bullish momentum based on where we currently are within structure.

We are STILL close to a VERY RARE & HISTORICAL event. We are STILL close to a VERY RARE & HISTORICAL event.
This would be the 2nd time in 125 years we get a "SUPER" Capital Rotation Event.
Stock markets get DESTROYED when adjusted for inflation.
While gold, silver & friends enjoy their BEST years of GAINS and OUTPERFORMANCE!

US30, Big Money Waiting Below, Buy the Dip or a Trap?📌 Market Structure
On the higher timeframe, H4 structure remains bullish, indicating that institutional money is still in control.
The recent move on H1 shows a short-term downtrend, which appears to be a controlled pullback rather than a full trend reversal.
📌 Order Block & Volume
Price is approaching a clear Bullish Order Block on the H2 timeframe.
Strong volume expansion near the lows confirms that Big Money has already reacted in this zone.
This is not panic selling, but a technical retracement into demand.
📌 Liquidity Perspective
The recent sell-off has swept late buyers’ liquidity above previous highs.
After liquidity is taken, price often returns to an Order Block to rebalance and accumulate long positions.
📌 Trading Plan
Buy Zone: H2 Bullish Order Block
Stop Loss: Below the Order Block low
Target: Upper liquidity zone
Risk / Reward: Approximately 2 : 1, aligned with institutional trading logic
🧠 Final Thought
As long as the H4 uptrend remains intact, pullbacks should be viewed as accumulation opportunities, not reasons to panic.
⚠️ Disclaimer
This analysis is for educational purposes only.
Not financial advice. Always manage your risk.


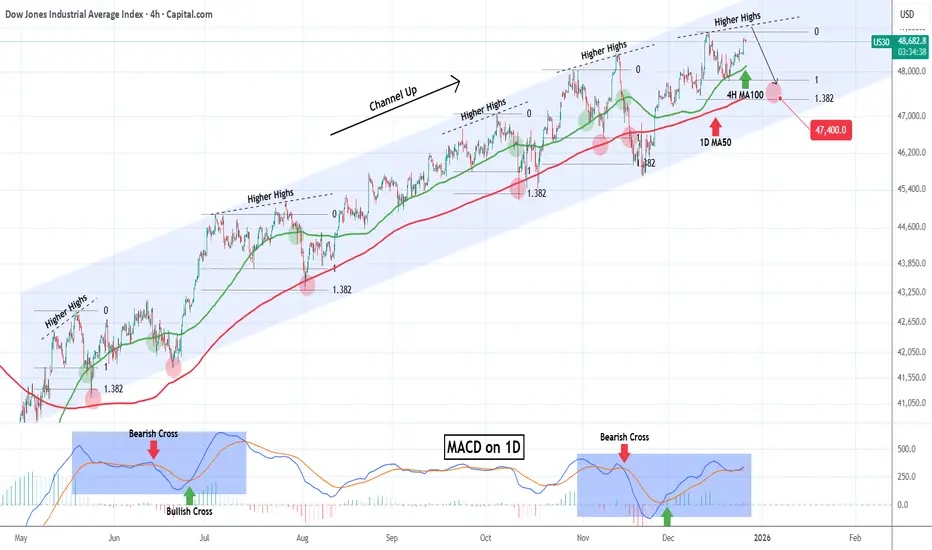
DOW JONES headed towards a rejection.Dow Jones (DJI) has been trading within a nearly 8-month Channel Up and is close to its All Time High (ATH) after rebounding last week on its 4H MA100 (green trend-line).
This pattern is cyclical and every time the latter support broke after a medium-term rally from its 1D MA50 (blue trend-line), the index got rejected on a Higher Highs trend-line and corrected back to the 1D MA50. Even the 1D MACD is printing a sequence similar to June - July.
As a result, we expect the new year to find Dow on its 1.382 Fibonacci extension at 47400 at least, which is the Fib level that every such correction pulled back to.
---
** Please LIKE 👍, FOLLOW ✅, SHARE 🙌 and COMMENT ✍ if you enjoy this idea! Also share your ideas and charts in the comments section below! This is best way to keep it relevant, support us, keep the content here free and allow the idea to reach as many people as possible. **
---
💸💸💸💸💸💸
👇 👇 👇 👇 👇 👇
US30 to close Year 2025 bearish The stock has rallied upward most part of the last half of the year ,
Technically it looks set as the key zone seems to be respected ,
The activities of next week after xmas and boxing day holidays will decide

US30 Technical Outlook: Sellers Control Below 48420US30 | Technical Overview
The market maintains a bearish momentum while trading below the pivot line (48420).
A move toward 48250 is expected first
A break below 48250 would support further downside toward 48020
Alternatively, a bullish scenario will activate only if the price holds above 48420, which could push the index higher toward 48670 and 48850.
Key Levels
Pivot Line: 48420
Support: 48250 – 48020
Resistance: 48670 – 48850

US30 | Break Above 48850 Opens Path Toward 49250US30 | Technical Overview
US30 maintains a bullish momentum as long as the price trades above the 48680 pivot level.
Above 48680: bullish continuation toward 48850, and a break above this level may extend gains toward 49250.
A 1H candle close below 48680 would signal a bearish corrective move toward 48540, followed by 48420.
Key Levels
Pivot Line: 48680
Resistance: 48850, 49260
Support: 48540, 48420
Bias: Bullish above 48680; corrective below it.

US30 PULLBACK AHEAD|SHORT|
✅DOWJONES has delivered a strong bullish displacement into a higher-timeframe supply zone, where buy-side liquidity is now being mitigated. The reaction suggests smart money distribution at premium, with a likely short-term pullback as price seeks internal liquidity below. Time Frame 3H.
SHORT🔥
✅Like and subscribe to never miss a new idea!✅

US30 Trade Set Up Dec 29 2025Price has retraced down to test Daily FVG and PDL, so first id like to see if sweep PDL and fill the gap before looking for internal 1m-5m IFVG/CISD to take price higher back towards PDH

US30 Bearish Reversal After Trendline BreakdownUS30 on the 4H timeframe is showing signs of a potential bearish reversal after a strong bullish run. Price respected a rising trendline for an extended period but is now showing weakness near the upper resistance area around 48,500. Recent candles suggest rejection and loss of bullish momentum, indicating buyers are struggling to push higher. A break below the trendline and cloud support would strengthen the bearish outlook. If selling pressure increases, price is expected to move lower toward key support zones. The first downside target stands at 48,254, followed by 48,021. A sustained move lower could open the way for a deeper correction toward the 47,450 level.
If you found this XAUUSD analysis helpful, don’t forget to LIKE 👍 and COMMENT 💬!

US30 & SP500 | Market Structure at Key Inflection ZoneMarket Structure & Pattern Overview
Both US30 and SP500 are currently developing within a rising wedge structure on the Daily timeframe , characterized by rising swing highs and rising swing lows within a narrowing range.
On the momentum side, RSI shows a wide divergence , indicating a shift in momentum behavior while price continues to press higher within the structure.
Additionally, current price action may represent the formation of a potential second top , adding another structural layer worth observing from a pattern perspective.
This combination highlights a broader confluence between price structure, chart patterns, and momentum behavior , especially as price approaches technically sensitive zones.
The chart is shared to illustrate how patterns and momentum can be analyzed together within market structure — without predictions or directional assumptions.
Shared strictly for educational and analytical purposes.
No financial advice. No guarantees.
All decisions remain the sole responsibility of the reader and should align with their own ethical, legal, and religious principles.

US30 Trade Up Dec 31 2025Price is overall bearish on the 4h and has swept Asia and London highs so i will wait for internal 1m-5m IFVG/CISD to take sells lower to London lows

US30 Technical Breakdown – 12/29/2025📍 US30 Technical Breakdown – 12/29/2025
US30 is consolidating just below the 48,750–48,850 resistance zone after a strong impulsive rally from the 47,800 demand area. Bulls remain in control overall, but price is clearly pausing as momentum cools and EMAs begin to flatten under resistance 🔍📉.
📊 Market Behavior:
🔹 Strong impulsive leg higher → bullish structure intact
🔹 Price stalling below 48,850 supply → sellers active here
🔹 EMAs still bullish but compressing → momentum slowing
🔹 Higher lows holding → no confirmed reversal yet
📌 Key Levels:
🔹 Resistance:
48,760 → immediate intraday resistance
48,843 → major supply / prior rejection high
49,000 → psychological level + liquidity target
🔹 Support:
48,700 → short-term structure support
48,140 → key intraday demand
47,810 → major range low / strong demand
🧠 Bias:
Bullish while above 48,140 📈
📈 Clean break & hold above 48,850 → continuation toward 49,000
📉 Failure at resistance + loss of 48,700 → pullback toward 48,140
💡 Trade Ideas:
🔹 Bullish Setup:
Entry: 48,880 (break + retest of highs)
TP1: 49,050
TP2: 49,250
SL: 48,620
🔹 Bearish Setup:
Entry: 48,680 (loss of structure)
TP1: 48,300
TP2: 48,140
SL: 48,950
🎯 Summary:
US30 is digesting gains just below major resistance. As long as 48,140 holds, dips remain corrective. A breakout above 48,850 opens the door for a push into 49K, while rejection here could trigger a healthy pullback before continuation 🔥📊

US30 BEARISH SETUPWe have seen this play before, let's see if it turns out the same.
Merry Christmas 🎄 everyone

DowJones consolidation supported at 48132Key Support and Resistance Levels
Resistance Level 1: 48940
Resistance Level 2: 49180
Resistance Level 3: 49590
Support Level 1: 48132
Support Level 2: 47873
Support Level 3: 47640
This communication is for informational purposes only and should not be viewed as any form of recommendation as to a particular course of action or as investment advice. It is not intended as an offer or solicitation for the purchase or sale of any financial instrument or as an official confirmation of any transaction. Opinions, estimates and assumptions expressed herein are made as of the date of this communication and are subject to change without notice. This communication has been prepared based upon information, including market prices, data and other information, believed to be reliable; however, Trade Nation does not warrant its completeness or accuracy. All market prices and market data contained in or attached to this communication are indicative and subject to change without notice.

US30 Trade Set Up Dec 26 2025Overall im bullish. Price has broken out of the Asia range, swept London highs so now i will wait to see if price can sweep London lows to then form 1m-5m IFVG/CISD to target PDH

US30 odd flats Trading odd flats on US30 or DOJ JONE price moves off of odds flats 48,700 48,500,48,300 etc
Price made a new high around 48,750 if price fail to make another high i will be selling it once price give me signs
Looking on the daily i see a +order block + imbalance + liquidity looking to take a buy on the daily TF around odds flats 46,700 or 46,500
When trading from level to level there is a 200 pip easy in and out the market setup
First looking to sell us30 around 48, 700 and hold it to 46,500 then looking to seing trade this to a buy once price come in my levels,...

US30 Technical Breakdown – 12/30/2025📍 US30 Technical Breakdown – 12/30/2025
US30 is consolidating after a sharp rejection from the 48,750–48,850 resistance zone, with price now holding around the 48,480–48,500 area. The broader structure remains bullish, but short-term momentum has clearly weakened as price slips below fast EMAs and enters a pause phase 🔍📉.
📊 Market Behavior:
🔹 Strong rejection from 48,750 supply → sellers stepped in aggressively
🔹 Short-term EMA cross to the downside → momentum cooling
🔹 Price holding above key demand → structure not broken yet
🔹 Consolidation suggests expansion coming next
📌 Key Levels:
🔹 Resistance:
48,600 → intraday resistance / EMA zone
48,760 → major supply & rejection level
48,843 → range high / breakout trigger
🔹 Support:
48,480 → immediate intraday support (current price area)
48,340 → demand + structure support
48,142 → key higher-timeframe demand
47,810 → major range low
🧠 Bias:
Neutral-to-bullish while above 48,340 📈
📈 Reclaim & hold above 48,600 → push back toward 48,760–48,850
📉 Loss of 48,340 → deeper pullback into 48,140 demand

#DOWJONSE NOW 12/26look like he can break the trend line and ressistance
and open NY is here about 10 min
