ICPUSDT trade ideas

📈 ICP Parabolic Pump ! Internet Computer (ICP) is currently exhibiting a parabolic movement, and the price action is approaching a crucial resistance zone at $14. This key level holds significance, and a successful breach could trigger a rapid and steep upward movement, potentially reaching $20. This analysis explores the parabolic structure and the implications of breaking through the key resistance zone.
🔄 Parabolic Trajectory:
ICP's price movement is characterized by a parabolic trajectory, indicating an accelerated and steep incline in its value. Parabolic moves often suggest strong buying momentum and can lead to rapid price increases.
🎯 Key Resistance Zone at $14:
The identified resistance zone at $14 is a critical level that has historical significance. Breaking through this zone is anticipated to be a decisive move that could trigger substantial buying interest and propel the price higher.
🚀 Potential Rapid Upside Move:
The expectation is that if ICP successfully breaks through the $14 resistance zone, it could lead to a rapid and steep upside move. Parabolic structures are known for their potential to generate quick and substantial price increases, driven by increased demand and momentum.
🔍 Technical Significance of $14:
The $14 level serves as a technical milestone, as it represents a significant hurdle that ICP has struggled to overcome in the past. A successful breach would not only signal strength but also attract attention from traders and investors looking for confirmation of a bullish trend.
💡 Trading Strategy:
Traders should closely monitor the price action around the $14 level. A decisive break above this resistance zone may present an opportunity for bullish positions, with a target set at $20. However, caution is advised, and risk management strategies, including the use of stop-loss orders, should be implemented to navigate potential market volatility.
🔮 Future Outlook:
The technical analysis suggests that ICP's parabolic movement could lead to a significant breakout if the key resistance zone at $14 is breached. Traders should remain vigilant for potential entry points and be prepared for rapid price movements. The cryptocurrency market's dynamic nature underscores the importance of adaptability and risk management in trading decisions.

Icp short/longIf ICP could get back into channel it could go until top of the channel,otherwise it would drop until 12 then 11.8 and lower.

ICPUSDTmy entry on this trade idea is taken from a point of interest above an inducement.. I extended my stoploss area to cover for the whole swing as price can target the liquidity there before going as i anticipate.. just a trade idea, not financial advise

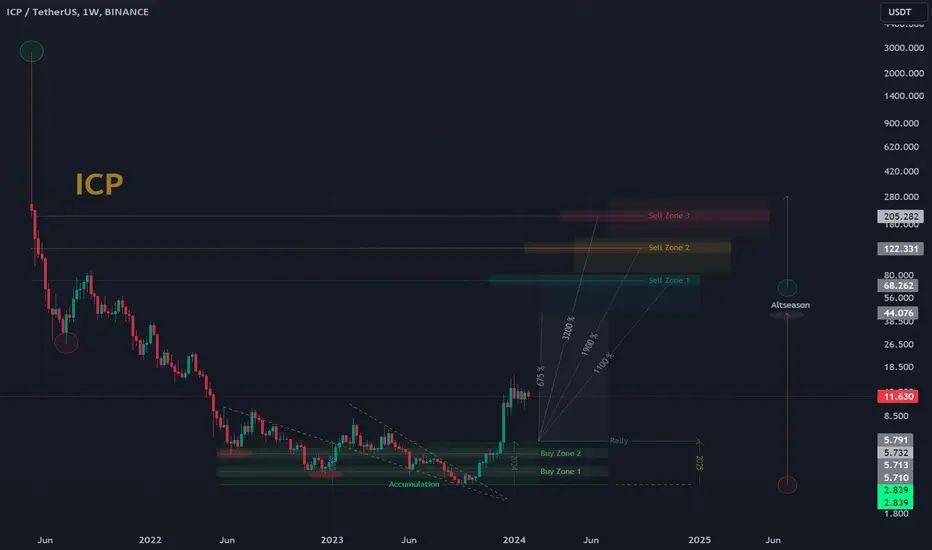
Are we expecting a 100% growth in ICP?Hello everyone!
Based on #ICP, I see the following targets - indicated on the chart, entry is possible after breaking the $15 mark.
This is not financial advice, everything you do is at your own risk.

ICP SMC Long SetupICP has demonstrated a noteworthy surge in buying activity, surpassing its previous high and exhibiting a noticeable Break Of Structure (BOS). Presently, ICP is navigating within a bullish chart pattern, suggesting potential for a breakout upon reaching the extreme Overbought zone, which is further supported by an IDM.

ICPUSDT.PICPUSDT.P is in bearish trend.
Poterntially printing LH and LL.
Sellers are strongly active.
No sign of reversal here.

$ICPUSDT consolidating on its H&SCRYPTOCAP:ICP consolidating on its H&S!
Is this the sign of CRYPTOCAP:ETH and alt coins losing its upward steam?
Does CRYPTOCAP:BTC gonna dump soon before New Moon next week?
#DYOR

ICPUSDT.4HBased on the provided market data, the Internet Computer (ICP) cryptocurrency is currently trading at a price of $13.200 against USDT. The relative strength index (RSI), which indicates whether a cryptocurrency is overbought or oversold, is at 60.68 for 4-hour trading, 60.88 for 1-day trading, and 72.49 for 7-day trading. These values suggest that ICP is neither overbought nor oversold, but it is closer to being overbought on the 7-day chart.
The Moving Average Convergence Divergence (MACD), a trend-following momentum indicator, is positive across the 4-hour, 1-day, and 7-day charts. This is a bullish signal that suggests the momentum is with the buyers.
The Bollinger Bands (BB), which measure volatility and provide relative definitions of high and low prices, are at 13.795 for 4-hour trading, 13.798 for 1-day trading, and 14.875 for 7-day trading. The current price is below the middle band in all three cases, indicating that ICP is trading in the lower range of its price.
The support levels are at 12.651, 11.190, and 10.451 for 4-hour trading, 11.889, 10.364, and 9.602 for 1-day trading, and 11.228, 9.538, and 8.552 for 7-day trading. These are the levels at which the price is likely to bounce back if it falls.
The resistance levels are at 13.992, 14.366, and 15.510 for 4-hour trading, 14.430, 15.500, and 16.460 for 1-day trading, and 14.277, 16.550, and 20.920 for 7-day trading. These are the levels that the price must break through to continue its upward movement.
In my opinion, ICP is showing bullish signals with its positive MACD and RSI that is leaning towards overbought. However, it's trading in the lower range of its price, and there are resistance levels to overcome for further upward movement. Therefore, investors should watch these indicators and levels closely and consider their risk tolerance and investment goals before making a decision.

ICPUSDT- H&SICPUSDT--
The bullish trend is end and make a H&S reversal pattern in the top of the market.
take a ride o bearish trend with use proper SL.

$ICP has broken out from a Bullish Pennant pattern.CP/USDT 🪙
CRYPTOCAP:ICP has broken out from a Bullish Pennant pattern, suggesting a potential 40-50% Price increase in the coming days.🎯🚀
You can enter at CMP & DCA at retest.
Or,
Also wait for the healthy retest for more clarity & confirmation.
Totally upto you.💯
Horizontal Support is at $8.80 &
Horizontal Resistance is at $15.30. 🎯✅

ICP - last pump is in progressHello, Skyrexians!
On ICP we can see the clear 5 waves structure. Wave 4 retraced inside the 0.5 Fibonacci zone and got reversal. Now we can wait for the wave 5. If we will see the divergence with Awesome Oscillator it's gonna be the sign for the huge correction.
Follow us and never miss update

ICPUSDT IDEAUPDATE
Breakout of Bullish Pennant in 1D.
Successful breakout may lead +30% Bullish move in due time!!!
COIN DETAILS
The live price of Internet Computer is $ 12.72 per (ICP / USD) with a current market cap of $ 5.82B USD. 24-hour trading volume is $ 181.97M USD. ICP to USD price is updated in real-time. Internet Computer is +9.4% in the last 24 hours with a circulating supply of 457.65M. ICP Price History USD.

ICPUSDT 8HBullish Pennant broken out to the upside. Short-term targets are $15.75 and $17.23
You can check rest of targets on the chart.

ICP/USDT Nearing a Critical Supply Zone Boom or Not?🚀ICP💎 Paradisers, gear up as we spot a thrilling chance with #ICPUSDT, which is on the verge of challenging a significant supply zone.
💎 Observing #InternetComputer trajectory, it's been painting the chart with strong green candles, aiming to shatter the supply zone at $14.049. Here's a crucial point: if the price honors the supply at $14.09, we might see a retreat to the lower demand at $12.013. However, should CRYPTOCAP:ICP disregard this supply ceiling at $14.049, an ascent could be on the cards.
💎 Wondering about the savvy trader's playbook? Vigilance is key, especially with potential price action traps lurking. Remember there's also a chance for a bullish bounce from the demand zone, should our initial read not pan out, with a dip below $12.013 hinting at further declines.

seems like icp preparing for another bullish rally trend is already up and strong now seems like icpusdt is ready for another higher high
bullish pennant breakout has already confirmed expecting another 45 to 50% bullish wave in coming days
keep eyes on icp


ICP inefficiency about to be fillICP is the trade that caught our attention today... After a long consolidation below we see good movement to the upside but unfortunately ICP facing huge resistance on 4hrs and 1hr TF....
When ICP pumped previously we cool see a CHoCH in 4hrs and 1hr TF to the downside with an inefficiency left behind...I'm expecting ICP to fill the inefficiency today and mitigate the unmitigated bearish OB on 1hr TF.... Be patient for the entry and manage your risk
Follow for more market update and trade setup

ICP/USDT | InternetComputer |1D 👀1. The tool has performed admirably as expected, but this doesn't necessarily indicate the beginning of a bull rally.
2. For now, I remain bearish for the first quarter, but come April, I will fully transition to the buyer's side and hold all instruments in the portfolio.
3. The next week will be crucial, informative, and volatile. I am exercising patience and sticking to the plan.
- Not financial advice, trade with caution.
✅ Stay updated on market news and developments that may influence the price of InternetComputer. Positive or negative news can significantly impact the cryptocurrency's value.
✅ Exercise patience and discipline when executing your trading plan. Avoid making impulsive decisions driven by emotions, and adhere to your strategy even during periods of market volatility.
✅ Remember that trading always involves risk, and there are no guarantees of profit. Conduct thorough research, analyze market conditions, and be prepared for various scenarios. Trade only with funds you can afford to lose and avoid excessive risk-taking.
#Crypto #InternetComputer #Investing #ICP
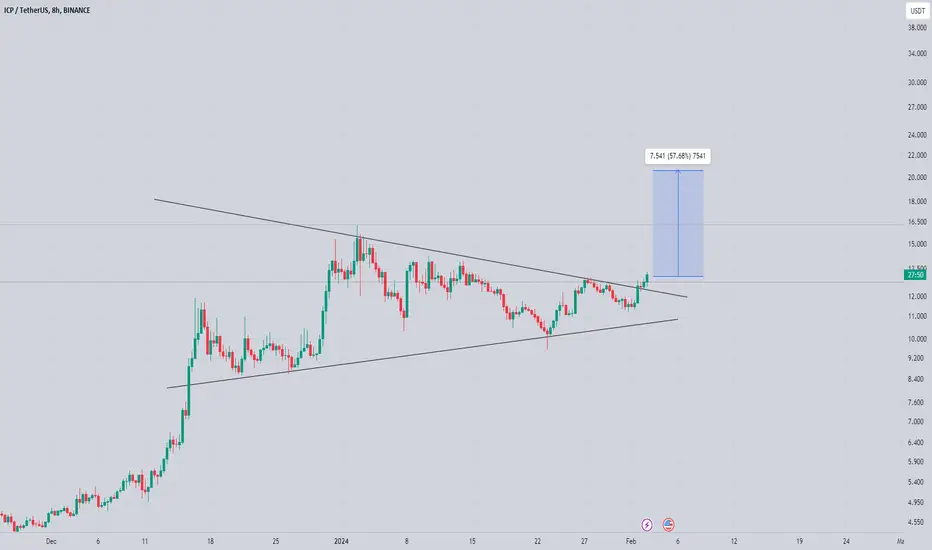
Double Bottom Breakout and Symmetrical Triangle = PUMPInternet Computer (ICP) has undergone an extended period of trading within a horizontal accumulation pattern, accompanied by the formation of a significant double bottom pattern with a liquidity grab. Following the successful execution of the double bottom pattern, ICP broke out from the accumulation range, and it is currently trading within a symmetrical triangle. The anticipation is for a potential upward breakout from the symmetrical triangle pattern.
🔄 Horizontal Accumulation and Double Bottom Formation:
ICP's extended consolidation within the horizontal accumulation pattern provided the groundwork for the formation of a double bottom pattern. The pattern is characterized by a strategic liquidity grab, indicating a shift in market dynamics and potential accumulation of positions.
🚀 Double Bottom Breakout Impact:
The successful breakout from the double bottom pattern signified a reversal of the prevailing bearish sentiment. This breakout is indicative of increased buying interest, potentially paving the way for a sustained upward move.
🔍 Symmetrical Triangle Formation:
ICP is currently trading within a symmetrical triangle, marked by converging trendlines that create a triangular pattern. The symmetrical triangle often represents a period of consolidation and indecision in the market, with the potential for a significant breakout.
💡 Anticipating Upward Breakout:
The symmetrical triangle pattern suggests that ICP is coiling within a tightening range. An upward breakout from the symmetrical triangle could signal a continuation of the bullish momentum initiated by the double bottom breakout. Traders and investors may anticipate potential higher price levels if the symmetrical triangle is breached to the upside.
🔮 Future Outlook:
The technical analysis indicates a favorable setup for ICP, with the successful execution of the double bottom pattern and the current consolidation within a symmetrical triangle. Traders should closely monitor the price action for confirmation of an upward breakout from the triangle pattern. The cryptocurrency market's dynamic nature emphasizes the importance of adaptability and risk management in trading decisions. If the symmetrical triangle is decisively breached to the upside, it may open the door for further upward movement in ICP.

ICP- I expect a new leg upIn my previous ICP post, I presented a potential trading plan for this coin. I stated that a break above 14 would indicate that the correction was over. Conversely, if we experienced a break of the symmetrical triangle to the downside, ICP/USDT could drop to 10, presenting a great buying opportunity.
The coin followed the latter scenario. As observed from the chart, it reversed precisely from the indicated support zone and reached a local high at 13. Now, ICP/USDT is undergoing a correction of this initial upward movement, potentially providing a new opportunity to enter long positions.
In conclusion, my preference is to buy dips around 11.50-11.70, with a target in the recent high zone around 16 and negation occurring under 10. Looking at the longer term, as explained in my previous posts, my target is the 20-22 zone.

ICP LongICP Long
Broke out of the trendline and looking to long to next supply zone @ 13.40~
TP1 12
TP2 12.40
TP3 13
TP4 13.40+
SL 10.90
Leverage 5-10x
