ICXBTC Bullish Breakout Idea and retestbuy : 1980 - 1995
target : 5 to 30 %
Stop loss : 3% (bitcoin is having bullish macd cross on 4hr time frame , so don't open any trade without stop loss )
ICXBTC trade ideas


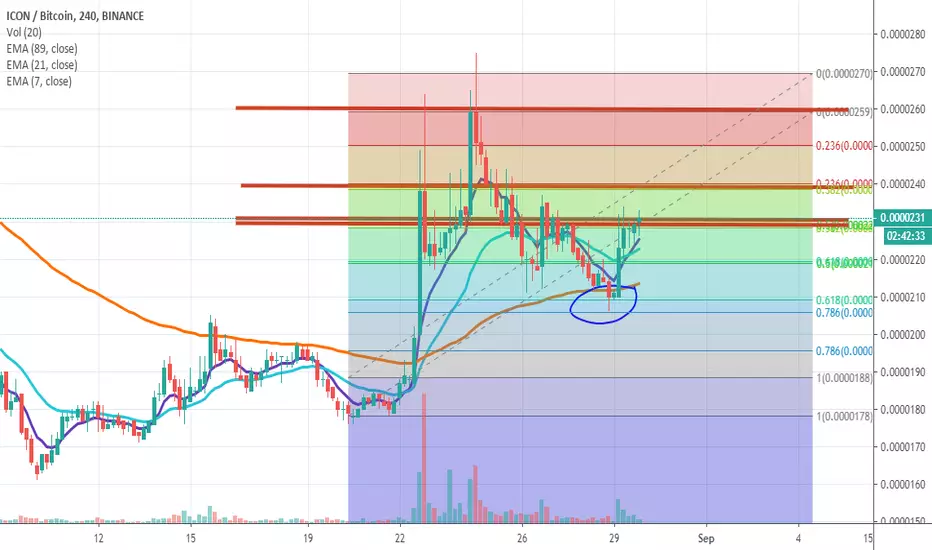
ICXBTC Ascending Triangle | Bull Volume?Hello Traders!
Today’s chart update will be on ICXBTC pairings, Potential Ascending Triangle,
Points to consider,
- Trend currently bullish on 240 timeframe
- New Higher Low potentially in place
- Structural resistance in confluence with .382 Fibonacci Level
- Stochastics showing upwards momentum
- RSI bouncing of local support
- Volume extremely low
- EMA’s holding price support but looks weak
- Potential Ascending triangle forming (bullish pattern)
ICX/BTC pairings has being putting in structural lower highs coming into a major resistance zone that is in confluence with the .382 Fibonacci level, a break will only come to fruition if we see an increase in volume, which is currently below average…
The stochastics currently has momentum projected upwards, which is necessary as ICX is currently testing it’s upwards trend line, putting in its next potential higher low. The RSI is quite neutral as it bounces of current local support; we do need a third touch to confirm its significance though. The EMA’s are trying to hold price as support, however does look quite weak as we don’t have the required bull volume as of yet.
Price action overall looks like its forming a potential Ascending Triangle, which will break bullish from local resistance if volume shows up, otherwise a fake out will be on the cards. A break can see us test the .50 and .618 Fibonacci levels respectively, as these levels are off significance compared to previous price action.
What are your thoughts?
Will ICX break bullish when testing resistance, or will lack of volume reject price?
Please leave a like and comment
And remember
Limit your size in any position so that fear does not become the prevailing instinct guiding your judgment - Joe Vidich


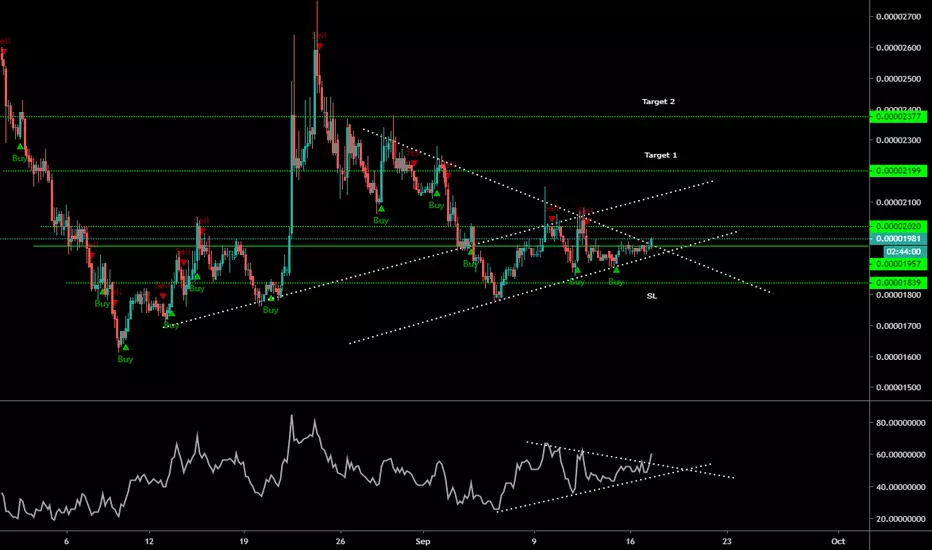
ICX-BTC Pair BreakoutICX-BTC pair seems to be breaking out of triangle
RSI is rising and seems to breakout of the trend line
SBS Indicator signaled BUY
BUY at the breakout or retest
Targets and Sl are on the chart


ICX showing bullish divergence at critical support levels $ICX ICX showing bullish divergence at critical support levels

$ICX, Trying to escape from descending channel..$ICX
Trying to escape from descending channel crossing above resistance at ~2k sats
For now volume looks low & it will need continuation after current candle for confirmation..
UCTS Signals starting to turn green on lower TFs
Set alerts & Wait.
#ICX

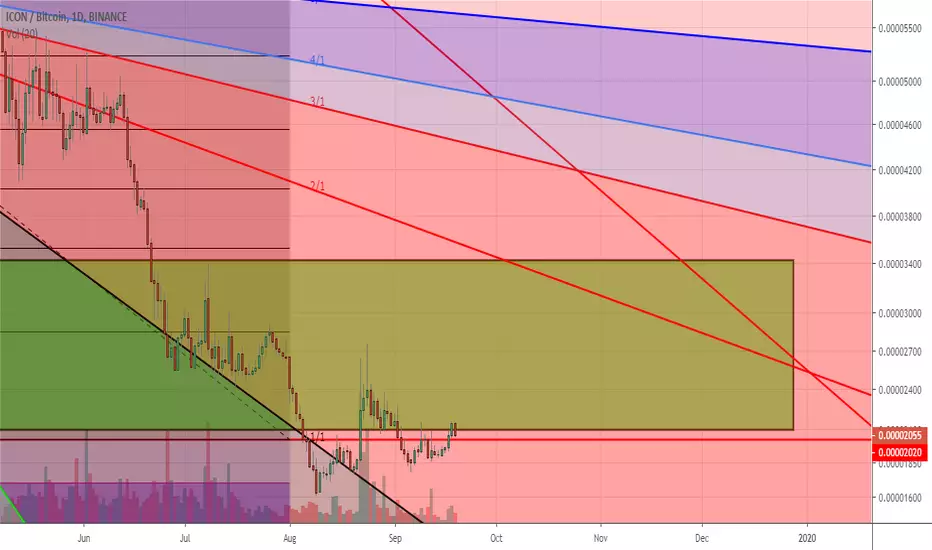
ICX-BTC / Long / Daily timeframe Ticker : ICX-BTC (ICON)
Entry : 178~183 satoshi
Stop loss : 161 satoshi(about - 10.56%)
Target : 245 satoshi(about +36.11%)
R-R : about 3.42


$ICX, About to lose ~2000sats support level on a LH/LL sequence$ICX
About to lose ~2000sats support level on a LH/LL sequence that seems to target ~1700 sats level (support) on a falling wedge pattern
Until new volume flows in & breaks from top trendline/flips R/S etc, I will stay on the sidelines here..
UCTS Sell signals on every TF
#ICX


$ICX, On a descending channel reaching Support at ~2000sats..$ICX
On a descending channel reaching Support at ~2000sats..
Unless we start doing HLs/HHs or a break above trendline bouncing from support I dont see too much to do here yet...
Wait for better signals of reversal/bouncing
UCTS Sell signals across all TFs
#ICX


Will we see ICON trend change ? ATR Calculation
In a nutshell, the true range calculation aims to determine the range of a trading session using the open, high, low, and closing price data. The formula to calculate true range:
Current high minus the previous close
Current low minus previous close
Current high minus current low
Once you have the true range value, you must choose a lookback period, Welles Wilders wrote about this in his book from 1978 titled New Concepts in Technical Trading Systems. He suggests using 14 days, and apply a moving average to the set of values.
How to use ATR with Price Action?
The use of ATR in the combination with price action is very useful in gauging trends. When price trends up / down while ATR is at a stable level - around 100 (BTC), is an indication of the continuation of that trend. When price trends down and ATR falls below 20(BTC), this is an indication that selling is being exhausted. When price trends up and ATR breaks 200(BTC), it indicates exhaustion of buying.