Rallies need breath. Corrections come next! Hello everyone!
It's almost the end of the year.
HSI has been bullish since starting of this year.
2024 - HSI closed with +3012pts; +17.67%
2025 - HSI has added ~+5000+pts; +24%++ at point of ✍️ since start of the year.
From W Chart:- Drawing your attention to year 2023,2024 & 2025.
You may see


Can HK50 Sustain Its Uptrend With This Triangular MA Pullback?HK50 “Hong Kong 50” – Index Market Trade Opportunity Guide (Swing / Day Trade)
🧭 Trade Plan Overview
✨ Bullish plan validated through a powerful combo of:
Triangular Moving Average Pullback 📉➡️📈
Heikin Ashi Reversal Candle Confirmation 🔄🔥
A clean momentum-shift setup indicating buyers preparing a fr


HK50 | Breakout Re-Test in Focus — Will Bulls Defend the Trend? HONG KONG 50 (HK50) | Swing Trade Setup 🚀📈
🎯 BULLISH BREAKOUT CONFIRMED | Multi-Timeframe Confluence ✅
📊 TECHNICAL SETUP
✅ Weighted Moving Average (WMA) pullback completed
✅ LSMA Breakout confirmed on higher timeframes
✅ Bullish momentum building across all indicators
✅ Price action respecting key

Hang Seng may be ready for the rally after testing 200-maThe Hang Seng index is locked in a consolidation, right above the 200-day moving average.
The market loses volatility, and in order to find a trigger for the move, it may need to test the strategic support zone below (200-day moving average).
That’s the common pattern for the triangular formation -

HSI technical outlookThe chart displays the long-term price action of the Hang Seng Index
, with technical features that highlight recent market dynamics. The blue trend lines define an upward channel, evidencing the index’s recovery pattern since its 2022 low and illustrating sustained bullish momentum. The red horizo

HSI Index Falls to November LowHSI Index Falls to November Low
Today, the Hong Kong stock index HSI is showing downward momentum, dropping below 25,200 for the first time since mid-October.
Factors adding to selling pressure include (according to media reports):
→ Tech sector slump: Hong Kong is following the US, where inves

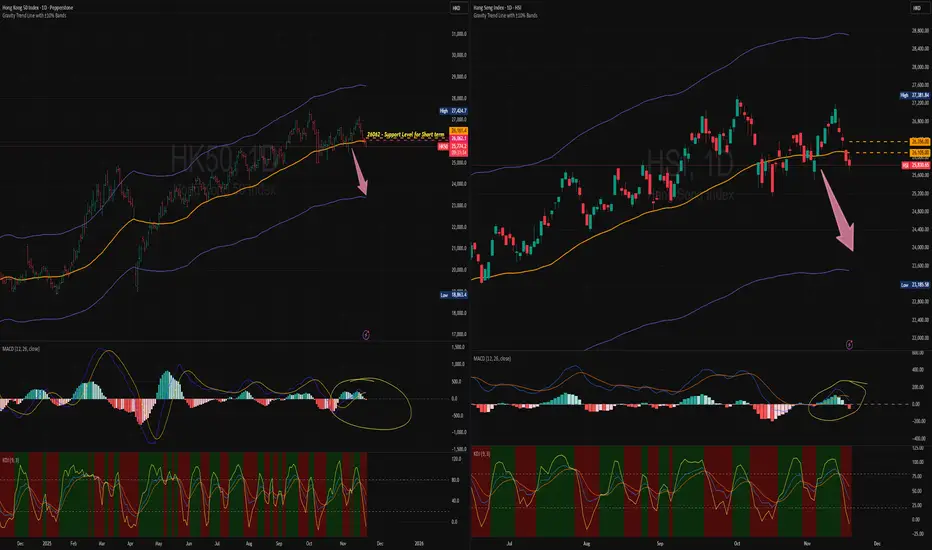
seems like Bear winds is blowing19Nov2025
Hello everyone!
HSI has been consecutively down for 4 days streaks.
For this week the HSI:-
🗝️🗝️ Important Support level : 26100 (which already broken down)
🗝️ Key Resistance level : 25850-25890
🗝️ Key Support level l : 25743 -25670
4h Chart:-
The cycle is repeating....history may n
HK50 Long Setup at 25,875Crab pattern completes on M30 and H1, marking a potential reversal zone near current price.
Triple bottom visible on M30 and H1, reinforcing a well defined support shelf.
RSI is rising as the triple bottom forms, which supports the idea of accumulation rather than a weak bounce.
Daily trend remai

See all ideas
Displays a symbol's value movements over previous years to identify recurring trends.
Frequently Asked Questions
Hong Kong HS50 Cash (HK50) reached its highest quote on Jan 29, 2018 — 33,505.7 HKD. See more data on the Hong Kong HS50 Cash (HK50) chart.
The lowest ever quote of Hong Kong HS50 Cash (HK50) is 6,544.8 HKD. It was reached on Aug 13, 1998. See more data on the Hong Kong HS50 Cash (HK50) chart.
Hong Kong HS50 Cash (HK50) is just a number that lets you track performance of the instruments comprising the index, so you can't invest in it directly. But you can buy Hong Kong HS50 Cash (HK50) futures or funds or invest in its components.