#ILV/USDT Bullish Reversal in MAGICUSDT Accumulation Zone#ILV
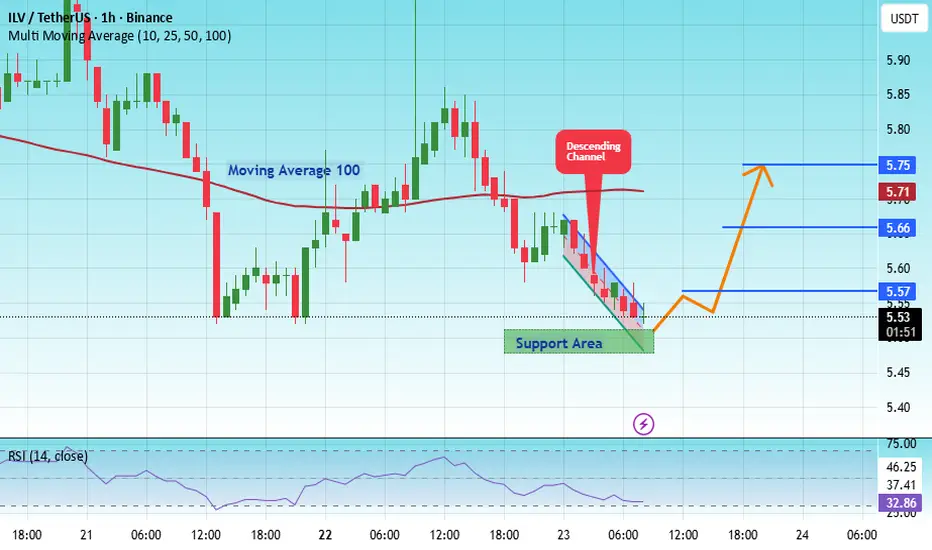
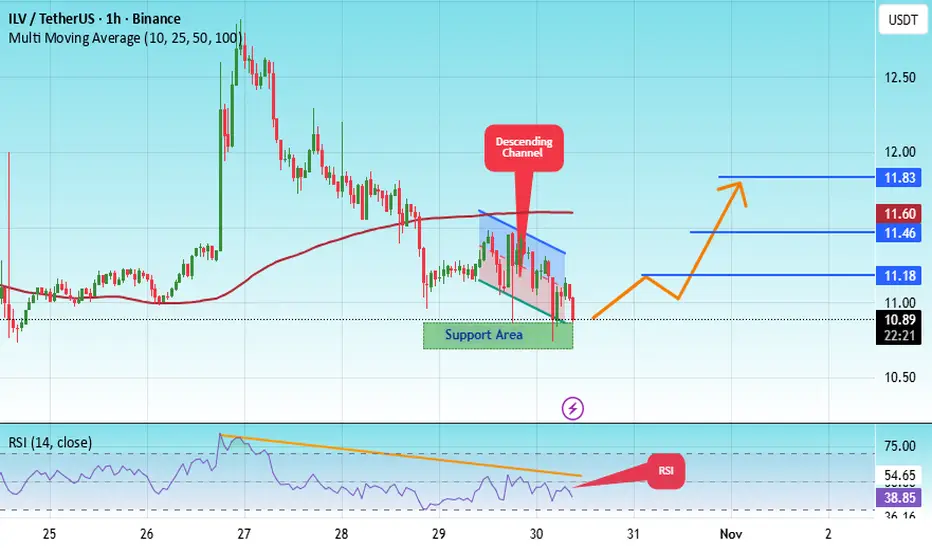
The price is moving in a descending channel on the 1-hour timeframe. It has reached the lower boundary and is heading towards breaking above it, with a retest of the upper boundary expected.
We have a downtrend on the RSI indicator, which has reached near the lower boundary, and an upward reb
Related pairs
#ILV/USDT Bullish Reversal in MAGICUSDT Accumulation Zone
#ILV
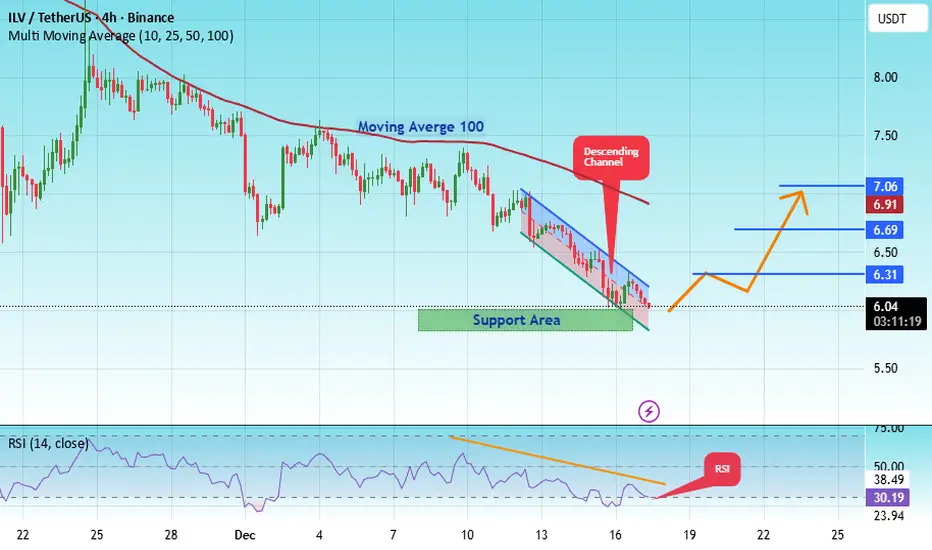
The price is moving in a descending channel on the 1-hour timeframe. It has reached the lower boundary and is heading towards breaking above it, with a retest of the upper boundary expected.
We have a downtrend on the RSI indicator, which has reached near the lower boundary, and an upward re
#ILV/USDT Bullish Reversal in MAGICUSDT Accumulation Zone #ILV
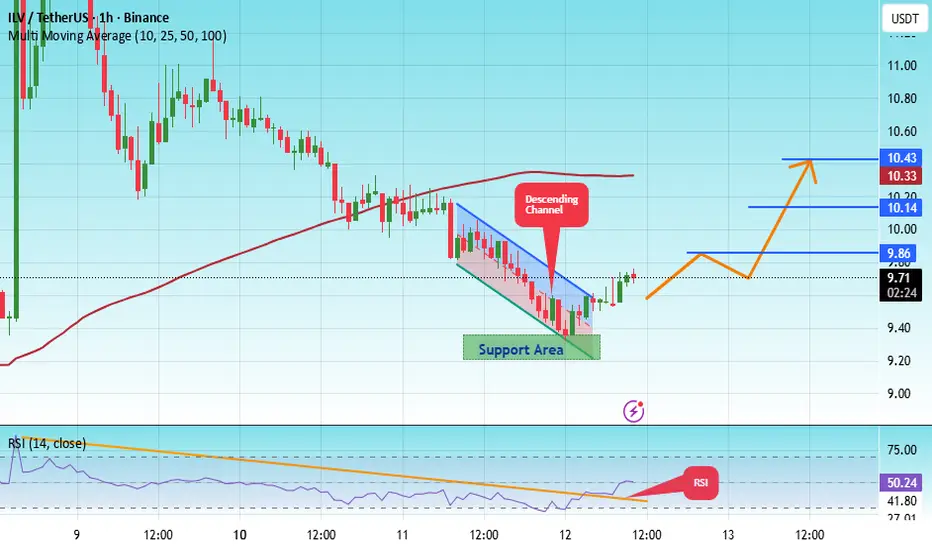
The price is moving within an ascending channel on the 1-hour timeframe and is adhering to it well. It is poised to break out strongly and retest the channel.
We have a downtrend line on the RSI indicator that is about to break and retest, which supports the upward move.
There is a key suppo
#ILV/USDT Forming Bullish Momentum !#ILV
The price is moving within an ascending channel on the 1-hour timeframe and is adhering to it well. It is poised to break out strongly and retest the channel.
We have a downtrend line on the RSI indicator that is about to break and retest, which supports the upward move.
There is a key suppo
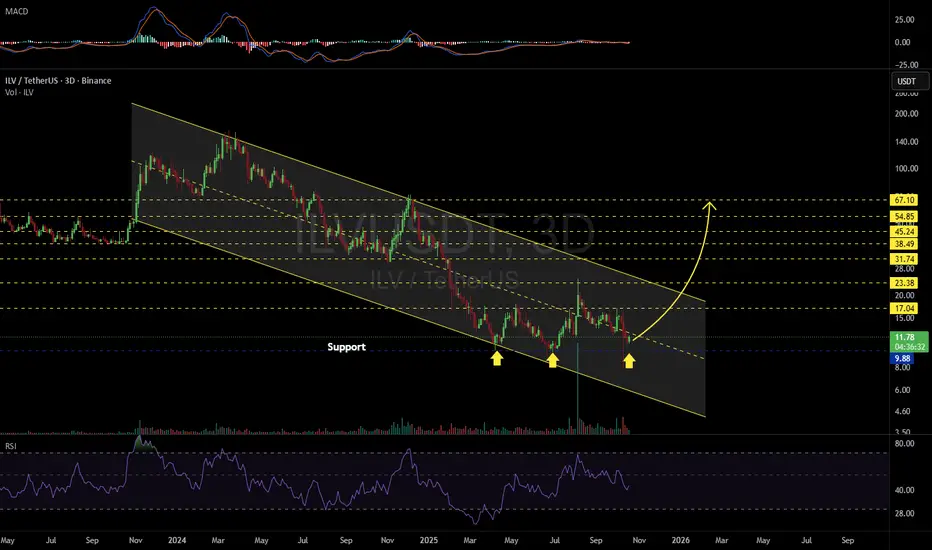
ILVUSDT 3D#ILV is moving inside a descending channel on the 3-day timeframe chart. In case of a successful bounce from the support and a breakout above the midline of the channel, we can expect the following targets:
🎯 $17.04
🎯 $23.38
🎯 $31.74
🎯 $38.49
🎯 $45.24
🎯 $54.85
🎯 $67.10
⚠️ Always remember to use a
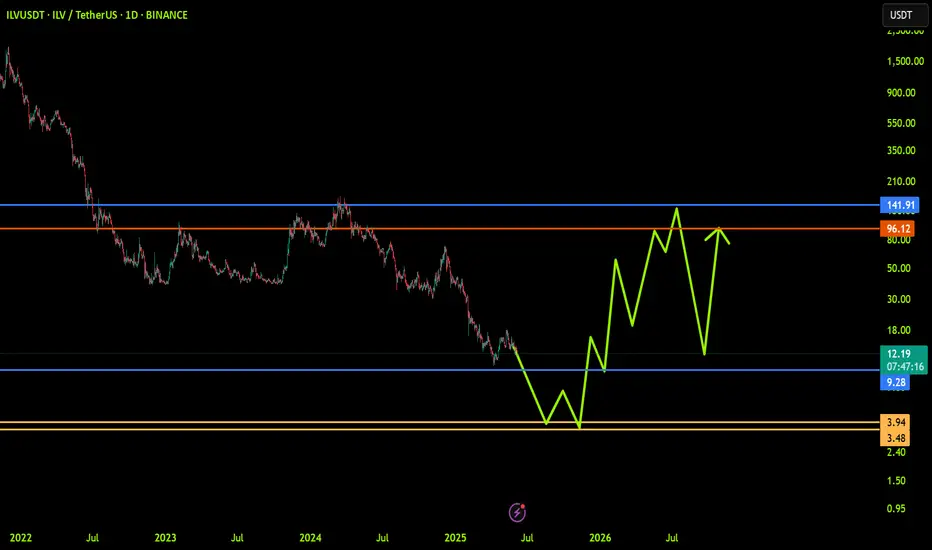
ILVUSDT: Trend in daily timeframeThe color levels are very accurate levels of support and resistance in different time frames, and we have to wait for their reaction in these areas.
So, Please pay special attention to the very accurate trend, colored levels, and you must know that SETUP is very sensitive.
Be careful
BEST
MT
ILVUSDT Forming Bullish MomentumILVUSDT has recently shown strong bullish momentum after bouncing from a major support zone. The price action indicates that buyers are stepping in aggressively, supported by good trading volume. This confirms renewed investor interest in the project, with expectations of a major rally in the coming
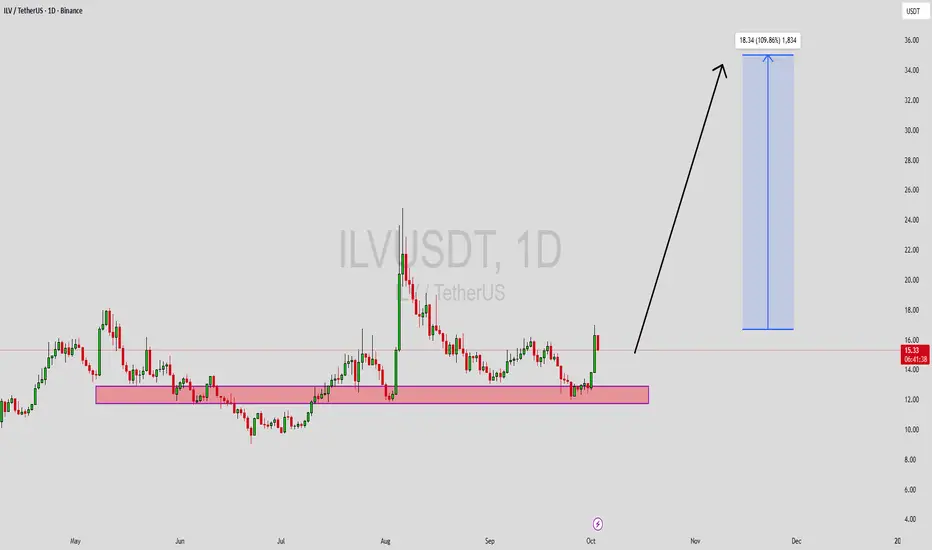
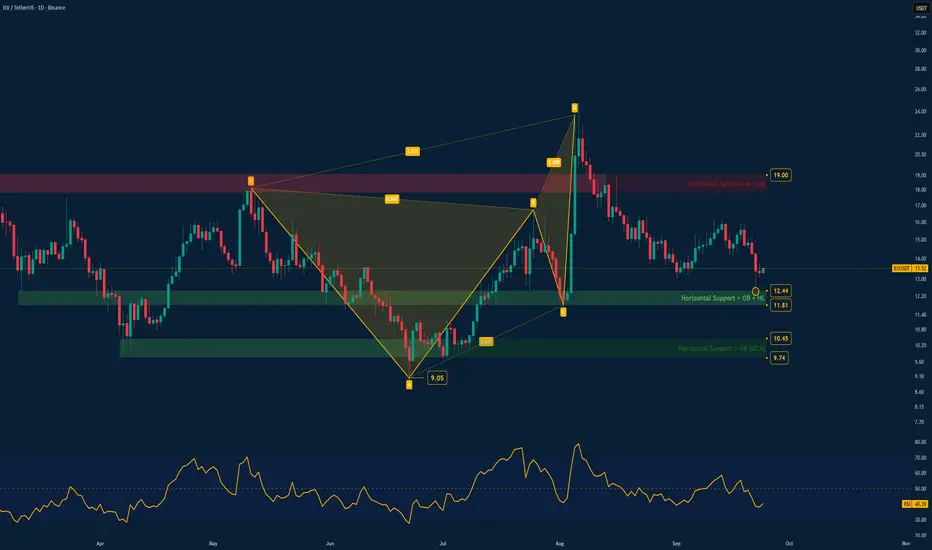
ILV/USDTBINANCE:ILVUSDT has touched the horizontal support zone corresponding to the C point of the bearish deep crab pattern.
This is strong support for ILV, and I now expect the price to turn upward.
I’ll update again if needed.
#ILV/USDT Forming Bullish Momentum !#ILV
The price is moving within an ascending channel on the 1-hour frame, adhering well to it, and is on its way to breaking strongly upwards and retesting it.
We have support from the lower boundary of the ascending channel, at 15.00.
We have a downtrend on the RSI indicator that is about to bre

See all ideas
Summarizing what the indicators are suggesting.
Oscillators
Neutral
SellBuy
Strong sellStrong buy
Strong sellSellNeutralBuyStrong buy
Oscillators
Neutral
SellBuy
Strong sellStrong buy
Strong sellSellNeutralBuyStrong buy
Summary
Neutral
SellBuy
Strong sellStrong buy
Strong sellSellNeutralBuyStrong buy
Summary
Neutral
SellBuy
Strong sellStrong buy
Strong sellSellNeutralBuyStrong buy
Summary
Neutral
SellBuy
Strong sellStrong buy
Strong sellSellNeutralBuyStrong buy
Moving Averages
Neutral
SellBuy
Strong sellStrong buy
Strong sellSellNeutralBuyStrong buy
Moving Averages
Neutral
SellBuy
Strong sellStrong buy
Strong sellSellNeutralBuyStrong buy
Displays a symbol's price movements over previous years to identify recurring trends.
Frequently Asked Questions
The current price of ILV / TetherUS (ILV) is 5.53 USDT — it has fallen −1.24% in the past 24 hours. Try placing this info into the context by checking out what coins are also gaining and losing at the moment and seeing ILV price chart.
ILV / TetherUS price has fallen by −9.25% over the last week, its month performance shows a −22.36% decrease, and as for the last year, ILV / TetherUS has decreased by −86.81%. See more dynamics on ILV price chart.
Keep track of coins' changes with our Crypto Coins Heatmap.
Keep track of coins' changes with our Crypto Coins Heatmap.
ILV / TetherUS (ILV) reached its highest price on Dec 1, 2021 — it amounted to 1,930.00 USDT. Find more insights on the ILV price chart.
See the list of crypto gainers and choose what best fits your strategy.
See the list of crypto gainers and choose what best fits your strategy.
ILV / TetherUS (ILV) reached the lowest price of 5.34 USDT on Dec 18, 2025. View more ILV / TetherUS dynamics on the price chart.
See the list of crypto losers to find unexpected opportunities.
See the list of crypto losers to find unexpected opportunities.
The safest choice when buying ILV is to go to a well-known crypto exchange. Some of the popular names are Binance, Coinbase, Kraken. But you'll have to find a reliable broker and create an account first. You can trade ILV right from TradingView charts — just choose a broker and connect to your account.
Crypto markets are famous for their volatility, so one should study all the available stats before adding crypto assets to their portfolio. Very often it's technical analysis that comes in handy. We prepared technical ratings for ILV / TetherUS (ILV): today its technical analysis shows the strong sell signal, and according to the 1 week rating ILV shows the sell signal. And you'd better dig deeper and study 1 month rating too — it's sell. Find inspiration in ILV / TetherUS trading ideas and keep track of what's moving crypto markets with our crypto news feed.
ILV / TetherUS (ILV) is just as reliable as any other crypto asset — this corner of the world market is highly volatile. Today, for instance, ILV / TetherUS is estimated as 2.73% volatile. The only thing it means is that you must prepare and examine all available information before making a decision. And if you're not sure about ILV / TetherUS, you can find more inspiration in our curated watchlists.
You can discuss ILV / TetherUS (ILV) with other users in our public chats, Minds or in the comments to Ideas.