IMXUSDT – Major Breakout or Another Painful Trap Ahead?Yello Paradisers, is this the real start of a powerful bullish reversal on #IMX, or just another classic setup to liquidate impatient traders before the true move begins? The next few days will decide everything.
💎#IMXUSDT has broken out of a falling wedge, which is a typical bullish reversal struc
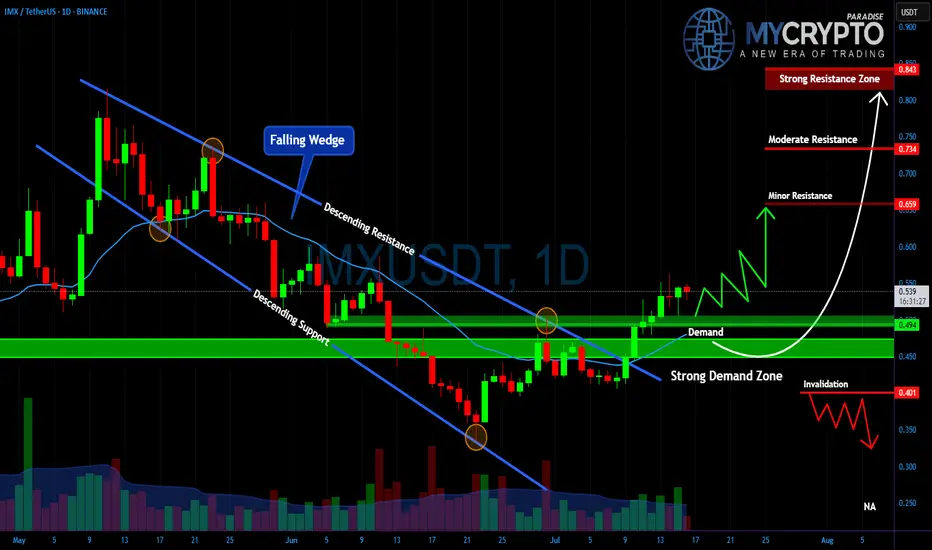
IMXUSDT 1D#IMX has broken above both the descending trendline and the Ichimoku Cloud on the daily chart — a strong bullish signal.
However, with RSI in the overbought zone and price nearing the daily SMA200, a rejection or short-term pullback is likely. A correction toward the $0.581–$0.559 range could offer

IMX Signals Reversal with RSI Bullish DivergenceIMX has shown a strong bounce from a demand zone, backed by clear bullish divergence on the RSI. Price printed a higher low on the oscillator while price action formed a lower low – a classic reversal signal. This area has acted as support multiple times in the past, and we can expect a reversal fro
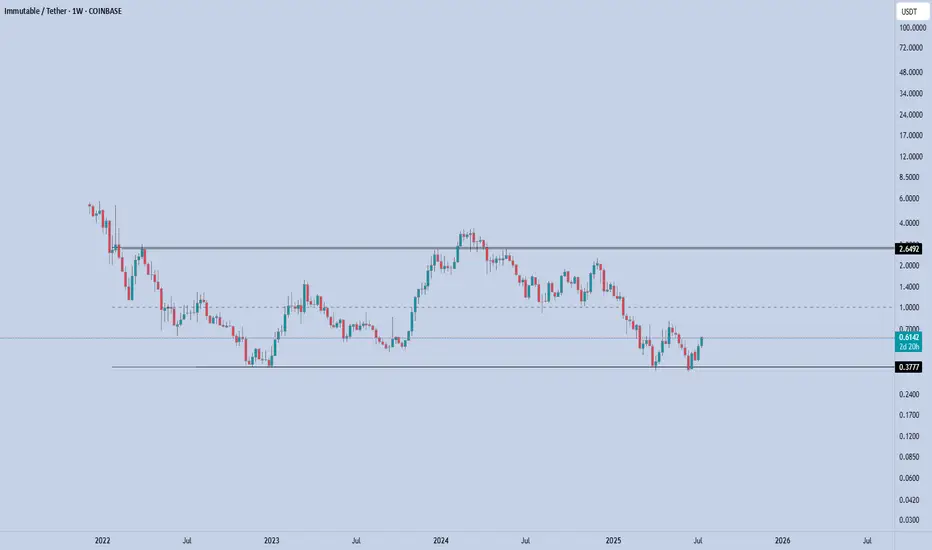
IMX – Range Low ReclaimedIMX has once again defended the $0.37–0.38 demand zone, bouncing sharply off the lows. This level has acted as a long-term accumulation base since late 2022, and price is now showing early signs of another range rotation.
Currently trading at $0.61, IMX is holding above the reclaimed support. As lo
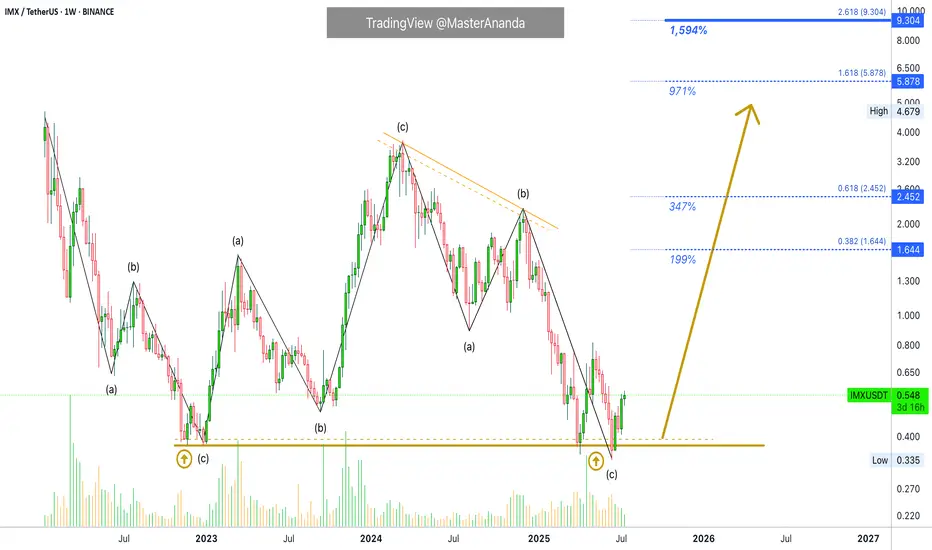
A New All-Time High Guaranteed for ImmutableX (1,600% PP)IMX produced a strong bullish cycle between December 2022 and March 2024. The entire bullish wave was corrected beyond 100%. This means that IMXUSDT hit a lower low. It went below the starting point of the last bullish wave. This is good in several ways.
The last move being deleted in its entirety
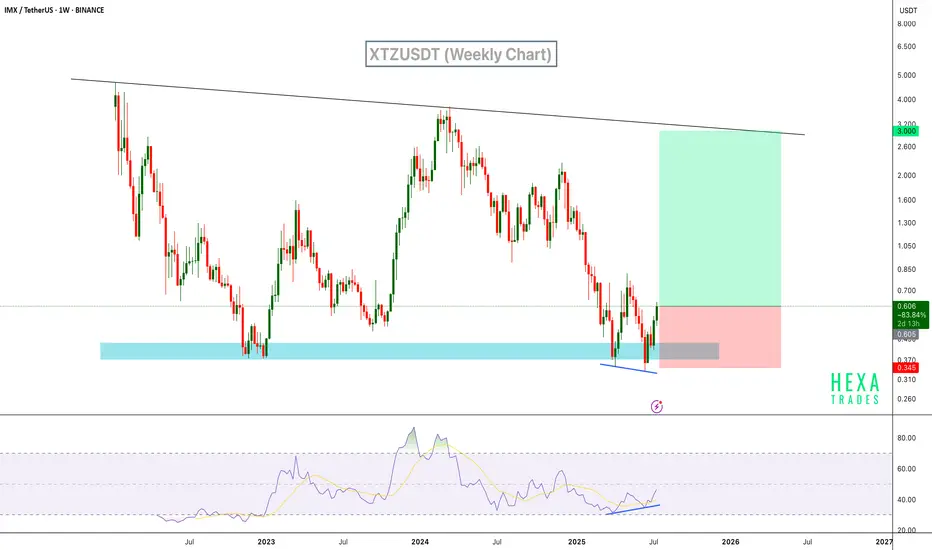
Next big target for IMX is 3$. IMX is setting its sights on the next big target at $3. It's currently trading within a large channel and showing a weekly hidden bullish divergence—an encouraging sign for upward continuation. A potential double bottom is forming, with the neckline around $0.71. If that breaks, the initial projecti

IMX — Double Bottom & Weekly RSI Div1. Buy sweep of all-time low, spot weekly RSI divergence
2. Entry: Confirm double bottom or strong bounce
3. Main target: $0.81+ (super bullish if break/hold above)
4. Stop: Below all-time low — scenario invalid

IMX IDEA FOR 2025🔥 SEED_DONKEYDAN_MARKET_CAP:IMX long setup (1 W) 🚀
✅ Entry Zone: $0.35 – $0.31 (multi-year demand)
🎯 Targets
• TP-1: $0.94 (Aug-23 supply)
• TP-2: $1.40 (Mar-24 breakdown)
⛔ Stop-Loss
Weekly close < $0.27
📊 Thesis
• #Immutable zkEVM mainnet live; Immutable X to merge → single Superch

IMXUSDT 6D AnalysisIMX ~ 6D Analysis
#IMX This is the lowest support block for now. Buy if you still have faith in this coin with a short term target of at least 20%+ from this support

$IMXUSDT looks bullishSEED_DONKEYDAN_MARKET_CAP:IMX looks bullish on the daily chart after a clean breakout and retest of the $0.595 support.
Price is holding above the trendline and 100MA, signalling strength.
If momentum continues, the next target is around $1.03.
DYOR, NFA.

See all ideas
Summarizing what the indicators are suggesting.
Oscillators
Neutral
SellBuy
Strong sellStrong buy
Strong sellSellNeutralBuyStrong buy
Oscillators
Neutral
SellBuy
Strong sellStrong buy
Strong sellSellNeutralBuyStrong buy
Summary
Neutral
SellBuy
Strong sellStrong buy
Strong sellSellNeutralBuyStrong buy
Summary
Neutral
SellBuy
Strong sellStrong buy
Strong sellSellNeutralBuyStrong buy
Summary
Neutral
SellBuy
Strong sellStrong buy
Strong sellSellNeutralBuyStrong buy
Moving Averages
Neutral
SellBuy
Strong sellStrong buy
Strong sellSellNeutralBuyStrong buy
Moving Averages
Neutral
SellBuy
Strong sellStrong buy
Strong sellSellNeutralBuyStrong buy
Displays a symbol's price movements over previous years to identify recurring trends.