POTENTIAL BEARS To complement the entire analysis of the major pairs shared on our previous posts, is this dollar index exhibiting a bearish AB D Correction pattern. And therefore we remain dovish.
Trade ideas

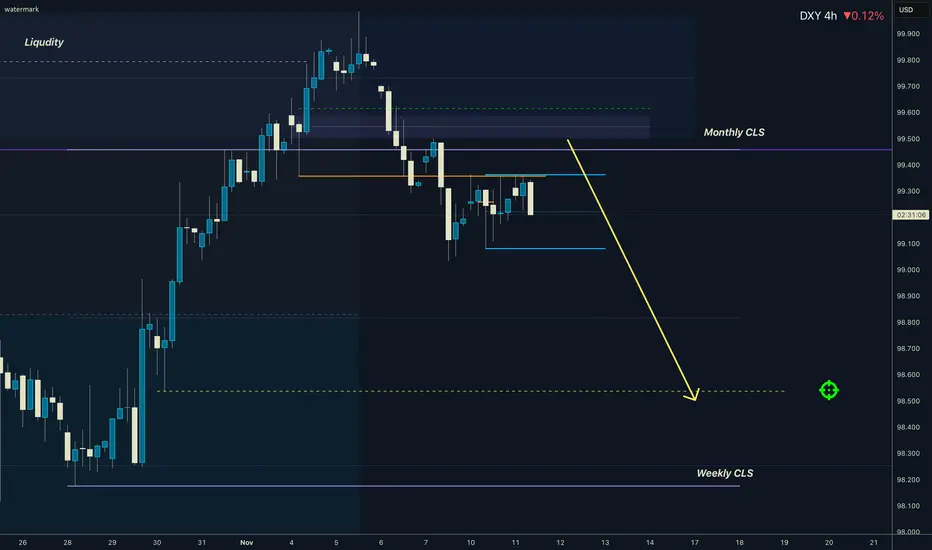
DXY I Weekly / Monthly CLS I Pullback to 50% of the CLS rangeHi friends, new range created. As always we are looking for the manipulation in to the key level around the range. Don't forget confirmation switch from manipulation phase to the distribution phase to make the setup valid. Stay patient and enter only after change in order flow. If price reaches 50% of the range take partial or full close.
📌 HTF - Higher Timeframe view 🧩 Complete proces and Strategy explained 👇 Click Below
🎯 Why your market approach also should be mechanical ?
NO Fixed Mechanical Trading Logic - You are guessing random patterns
NO Defined trading plan - Every trade different logic
NO Same logic in each trade - Not possible to backtest
NO Backtests on at least 300 trades - Not knowing Statistics
➡️ No Statistics ➡️ No Edge ➡️ Mindset ProblemS
🧠 Core of mindset problems
If you don't know your statistics on large enough data sample. You don't know your probabilities of win rate once the losing streak happen and it happens to every strategy. You will start doubting, hesitating to take next trade because you don't know statistics of your losses. In the end you will be doubting strategy and then jump to different one. You will be in the endless loop for years, looking for new better strategy. 👊 Your ultimate goal as a trader is not to be a generalist who knows 10 000 patterns. But rather create one system with narrowed criteria of each element of the trade to remove subjective and emotional decisions as much as possible and stick to this system no matter what. Practice it 10 000 times become a MASTER.
✨ Trading Mastery is reflection of your life
Have a longterm plan, No Alcohol & Drugs, Ignore others, Focus on your journey , Backtest regularly, Review your weeks, Journal mistakes, Exercise, Sleep well, Read books, Walks in nature (no phone) , Meditate, Reduce social media time, Spend time with family, Live Life.
Trading is hard, but not impossible. I believe in you 💪
David Perk aka Dave Fx Hunter
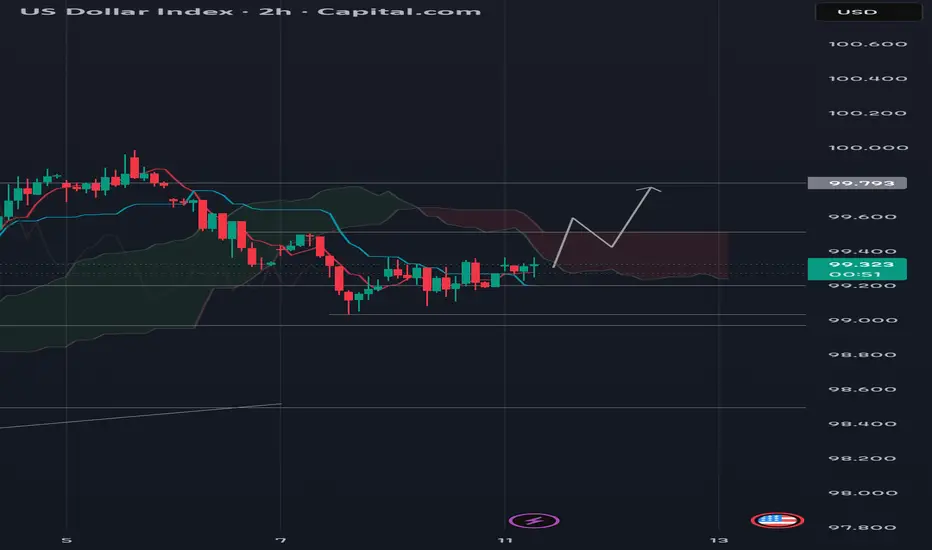
DXY (US Dollar Index) 2h Chart AnalysisThe DXY is currently consolidating in a tight range around the 99.30 mark after the recent move lower.
Current Price : 99.304
Key Support : The level around 99.00 looks like the next major psychological support.
Key Resistance: Bulls are currently gaining momentum but need to clear the upper bound of the recent consolidation, specifically the 99.40 - 99.50 area, to negate the short-term bearish pressure.
We are waiting for a breakout. A sustained break above 99.50 could see a retest of 99.80 - 100.00. A definitive move below 99.00 opens the door for a deeper correction towards the 98.80 area.
DXYU.S Dollar Index
- Bullish Channel as an corrective pattern in Long Time Frame
- Break of Structure
- Completed " 1234 " Impulsive Waves
- Fibonacci Level - 23.60%
- Demand Zone

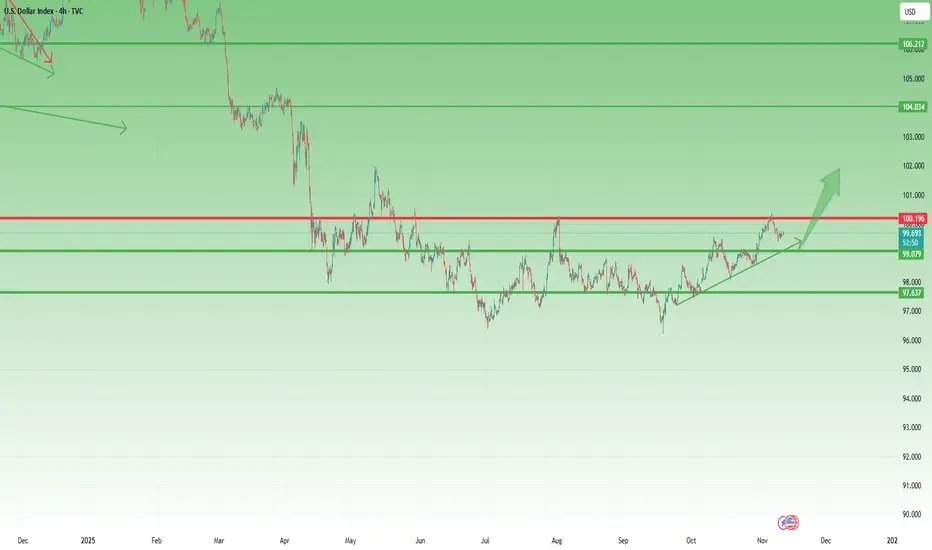
DXY Bullish strong trend resistance breakout bullish move📈DXY Bullish Outlook
The U.S. Dollar Index (DXY) is showing strong bullish momentum after a clean breakout above resistance — buyers stepping in from the key support zone at 99.400.
✅ Technical Levels:
Entry Zone: 99.400 (Support Base)
Targets:
🎯 First Target: 99.800
🎯 Second Target: 100.200
The 4H time frame confirms the breakout with higher highs and bullish structure.
⚠️ Note: Always apply proper risk management and stick to your trading plan.
#DXY #USDIndex #ForexAnalysis #TechnicalAnalysis #PriceAction #ForexTrading #BullishTrend #Breakout #RiskManagement
💬 Like | 💹 Follow | 🔁 Share

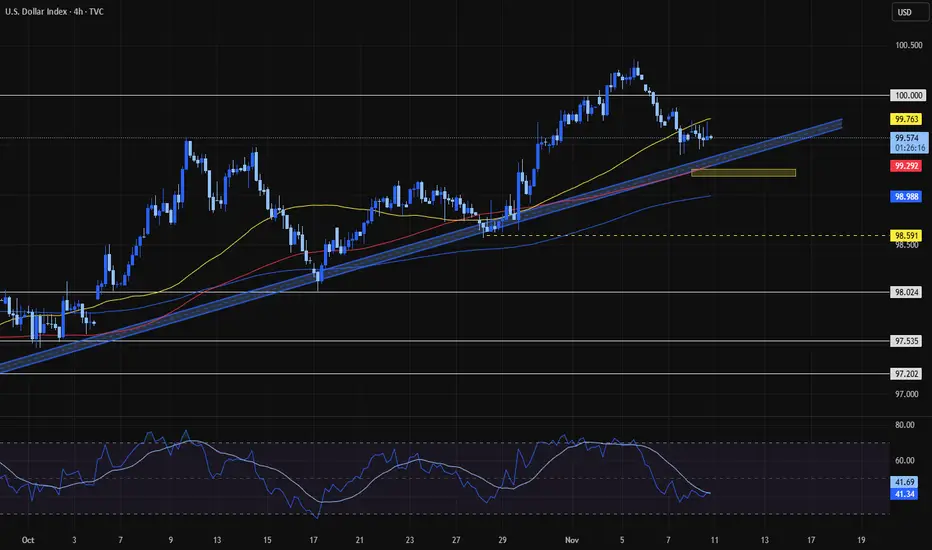
DXY Pulls Back from 100 – A Healthy Correction, Not a Reversal1. What Happened Since Last Week
In last week’s DXY analysis, I warned that although the U.S. Dollar Index remains in a broader uptrend, the 100.00 level represents both a strong technical and psychological resistance that could trigger a short-term retracement.
That scenario played out almost perfectly — after a brief spike above 100, DXY rolled over and is now trading near 99.70.
2. Market Context
The pullback so far looks orderly, not impulsive, suggesting that this move is a correction within an ongoing bullish structure, rather than the start of a major reversal. The market is simply digesting gains after a move higher.
3. Technical Outlook
The area between 99.00 and 99.20 stands out as a key confluence support zone, combining horizontal structure with the up trend line. This is where I expect buyers to reemerge if the index continues to drift lower.
4. Trading Plan
If DXY dips into 99.00–99.20, I’ll look for signs of USD strength resuming — specifically by considering short setups on GBP/USD and EUR/USD.
5. Conclusion
The dollar remains in an uptrend, and this pullback appears to be healthy, not bearish. As long as DXY holds above 99.00, the broader bullish bias remains intact, and traders should prepare for a possible rebound in the next sessions. 💵
DXY FRGNT Daily Forecast -Q4 | W46 | D11 | Y25 |📅 Q4 | W46 | D11 | Y25 |
📊 DXY FRGNT Daily Forecast
🔍 Analysis Approach:
I’m applying Smart Money Concepts, focusing on:
Identifying Points of Interest on the Higher Time Frames (HTFs) 🕰️
Using those POIs to define a clear trading range 📐
Refining those zones on Lower Time Frames (LTFs) 🔎
Waiting for a Break of Structure (BoS) for confirmation ✅
This method allows me to stay precise, disciplined, and aligned with the market narrative, rather than chasing price.
💡 My Motto:
"Capital management, discipline, and consistency in your trading edge."
A positive risk-to-reward ratio, paired with a high win rate, is the backbone of any solid trading plan 📈🔐
⚠️ Losses?
They’re part of the mathematical game of trading 🎲
They don’t define you — they’re necessary, they happen, and we move forward 📊➡️
🙏 I appreciate you taking the time to review my Daily Forecast.
Stay sharp, stay consistent, and protect your capital
— FRNGT 🚀
TVC:DXY

Bullish bounce off 50% FIbonacci support?Dollar Index (DXY) has bounced off the pivot and could rise to the 1st resistance, which acts as a swing high resistance.
Pivot: 99.41
1st Support: 99.13
1st Resistance: 100.29
Disclaimer:
The above opinions given constitute general market commentary, and do not constitute the opinion or advice of IC Markets or any form of personal or investment advice.
Any opinions, news, research, analyses, prices, other information, or links to third-party sites contained on this website are provided on an "as-is" basis, are intended only to be informative, is not an advice nor a recommendation, nor research, or a record of our trading prices, or an offer of, or solicitation for a transaction in any financial instrument and thus should not be treated as such. The information provided does not involve any specific investment objectives, financial situation and needs of any specific person who may receive it. Please be aware, that past performance is not a reliable indicator of future performance and/or results. Past Performance or Forward-looking scenarios based upon the reasonable beliefs of the third-party provider are not a guarantee of future performance. Actual results may differ materially from those anticipated in forward-looking or past performance statements. IC Markets makes no representation or warranty and assumes no liability as to the accuracy or completeness of the information provided, nor any loss arising from any investment based on a recommendation, forecast or any information supplied by any third-party.

Gbp/Usb bear forecast.Where price is now + DXY show a potential bearish movement on cable and potentailly see DXY send price higher for a premium wick CE may monthly candle. Until i talk to you nexttime God`s willing, Embrace the uncertainty with a cool headed. Thank`s

Update of the Dollar Index analysisWith confirmation of the break of the 99.250 zone, we can say the trigger for a sell has been activated.
DXY — Range Structure HoldsThe US Dollar Index (DXY) started the week trading just below a bearish distribution fractal low at 99.321. Price holds inside a short-term bearish range between 99.000 (low) and 99.500 (high) while still operating within the broader daily bullish structure. DXY is currently moving through the daily imbalance cap near 99.035, sitting in the premium zone — compression remains active as larger participants stay patient. Market Structure Mapping (MSM) shows price tightening in that upper zone — the calm before the bigger players step in.
Market Structure Mapping (MSM) shows price pressing into the daily imbalance high near 99.035, lining up with the range-low fractal around 99.032. That’s the lower edge of Monday’s structure — tight, clean, and holding steady. Volume Flow Analytics (VFA) points to order-flow absorption — buyers keep hitting the tape, but liquidity keeps taking the other side.
It’s that slow-burn type of session where participation fades and bigger players quietly build positions under the surface. If that pattern holds, price could drift back toward the discount area once participation increases.
No rush — London already had its short trade this morning.
Now it’s just about waiting for confirmed order flow before taking the next setup.
The dollar’s steady as Washington works on a funding deal to end the government shutdown, calming market nerves.
Ten-year Treasury yields hover just above 4.1 %, keeping a floor under USD as investors still get paid to hold dollars.
Inflation’s sitting near 3 %, growth data is mixed, and delayed reports mean traders are reacting more to headlines than numbers.
For now, yields and improving political tone offer support — but it’s not bulletproof.
If debt or growth headlines turn sour again, that support can fade fast.
🦅 CORE5 RULE:
Slow days build strong traders. Wait for the flow, not the noise.
— CORE5DAN
Institutional Logic. Modern Technology. Real Freedom.

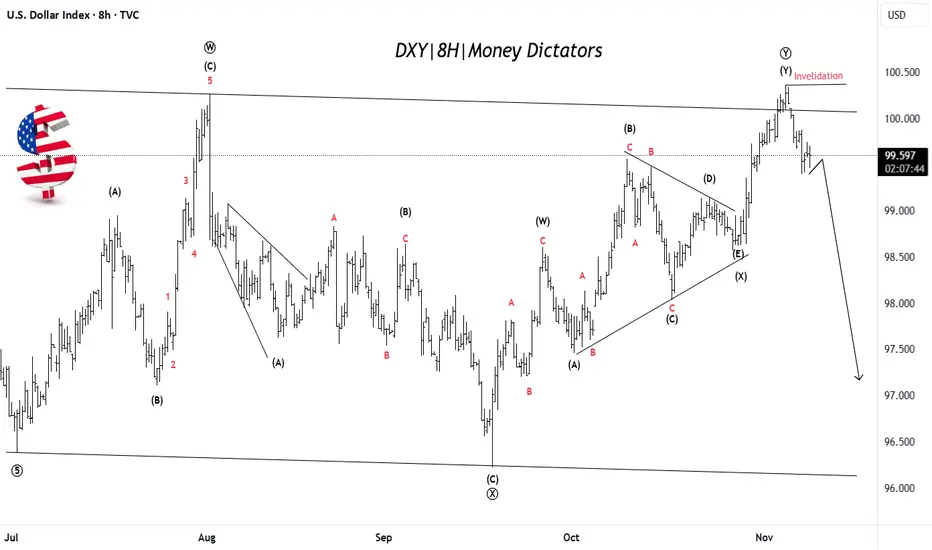
US Dollar Weakness Likely After Final Push UpDXY has completed a complex corrective W–X–Y pattern, with the final leg (Y) recently topping near the 100.50 zone. Price has failed to break above the invalidation level, suggesting the uptrend is losing strength. This signals that the dollar may have finished its corrective phase and could now start a fresh bearish wave targeting lower zones near 97–98. The overall structure indicates that momentum is shifting from bullish to bearish. In simple terms: rally is likely over → downside move toward new lows expected next.
Stay tuned!
@Money_Dictators
Thank you :)
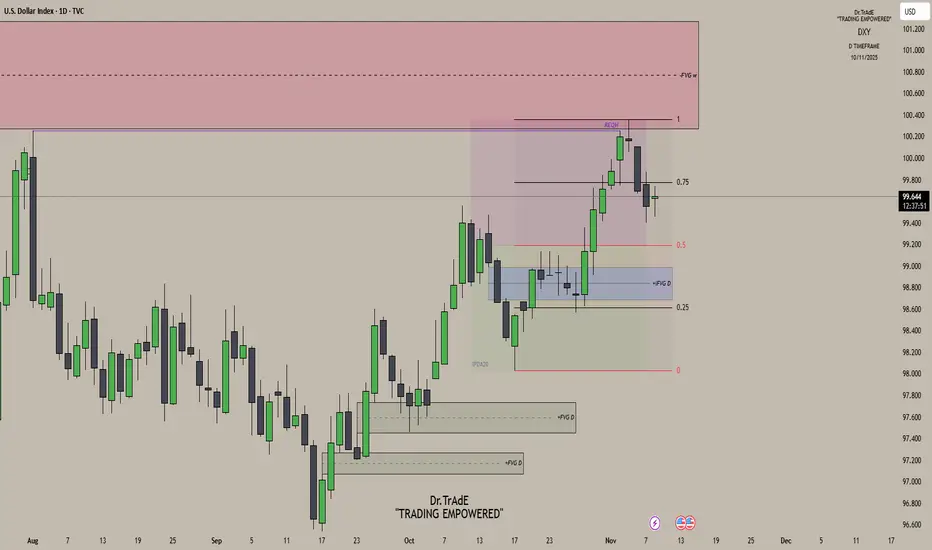
DXY Daily AnalysisLast Week’s Review:
Monday: Bullish delivery as price continued higher.
Tuesday: Price maintained bullish momentum but failed to take out the previous high, leaving equal highs — liquidity resting above.
Wednesday: That liquidity was swept as price reached into the weekly fair value gap, completing delivery to the premium array and initiating bearish distribution.
Current Outlook:
On the daily chart, we’re still trading deep inside premium, and price is showing clear signs of exhaustion after that delivery into the weekly FVG. With bearish distribution now in play, my bias remains bearish. Any short-term push back into the 0.75 quadrant, I’ll treat as a retracement — a chance for price to reprice some lower-timeframe inefficiencies before the next leg lower. On the 4H chart, I’ll be watching for price to trade back into short-term FVGs or inefficiencies that align with this overall bearish narrative.
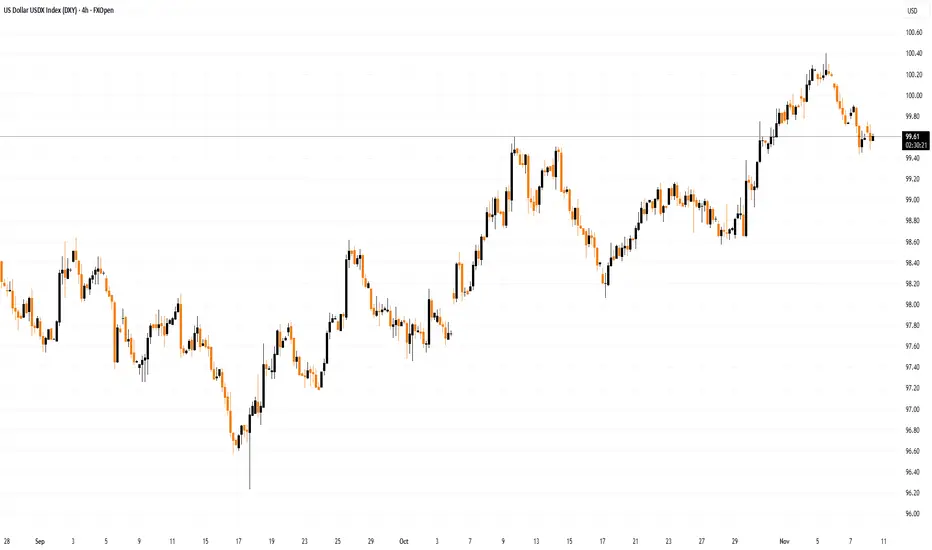
Dollar Index Pulls Back from a Key HighDollar Index Pulls Back from a Key High
As the Dollar Index (DXY) chart shows, the index is currently trading below its 5 November high, which formed after a false bullish breakout (marked by an arrow) above the 1 August peak — a scenario previously outlined in the post “The Dollar Index Near a Key High.”
According to Trading Economics, trader sentiment at the start of the week is being shaped by expectations of comments from ECB and Federal Reserve officials regarding the outlook for monetary policy.
A statement has already come from Reserve Bank of Australia Deputy Governor Andrew Hauser, who noted that financial conditions in the country are now close to a neutral rate — one that neither stimulates nor restrains economic growth. The Australian dollar strengthened following his remarks.
Technical Analysis of the DXY Chart
The previously drawn ascending channel remains relevant for the Dollar Index, with several important technical features:
→ The channel median has switched its role from support to resistance (as indicated by its colour change from blue to red).
→ The QL line, which divides the lower half of the channel into quarters, is currently acting as support for the DXY.
→ The index has fallen below the psychological level of 100 points.
It appears that the 3.7% rally in the Dollar Index since mid-September has attracted sellers, while late buyers may have been trapped near the top of the recent move.
Additional support may be found near 99.45, where a double-top pattern (A–B) previously formed. However, if this level is breached, the DXY could extend its decline towards the lower boundary of the channel.
This article represents the opinion of the Companies operating under the FXOpen brand only. It is not to be construed as an offer, solicitation, or recommendation with respect to products and services provided by the Companies operating under the FXOpen brand, nor is it to be considered financial advice.
USD Potential Retracement to 99.5I am anticipating a potential retracement on DXY :
Price has run above the recent daily range high. I am now anticipating a potential retracement or pullback.
I will be monitoring H4 and H1 Timeframe price action to see if H1 and H4 lows can start getting taken to validate the idea.
I will also be monitoring the close of Wednesdays Daily Candle.
I am anticipating DXY to pullback to around 99.475 to look for more long positions.
Once dxy has traded back to the key level / support area i will then target 100.360

Day market cautiously adjusts its bullish stance The DXY cautiously maintains its bullish stance, rising 1.52% since the last week of October. With momentum building, the index now sets its path toward mitigating the 101.000 level, signaling continued dollar resilience amid shifting market conditions. follow for more insights , comment and boost idea

DXY Selling view watch chart📉 DXY Update (4H Timeframe)
DXY currently reacting from the 100.300 supply zone, following selling pressure from the 100.000 level.
🔹 Technical Outlook:
Resistance / Supply Zone: 100.000 – 100.300
Support Levels: 99.800 🟡 | 99.500 🟢
Bias: Bearish below 100.000
💡 Price action shows signs of rejection at key resistance. Watch for confirmation before entering. Always trade with discipline and a clear plan.
⚠️ Risk Management Reminder:
Use proper position sizing and always protect your capital — no setup is 100% guaranteed.
👉 Like • Comment • Follow • Share
For more daily technical updates and insights 💹
#DXY #DollarIndex #ForexAnalysis #TechnicalAnalysis #PriceAction #TradingSetup #RiskManagement

US DOLLAR INDEX (DXY) shortsFor DXY, I am looking for a continuation of last week's sells. There are two supply area I am looking to short from. I will sit on my hands until price reaches these areas and give a confirmation for sells. One market reaches these levels, an update will be sent out. Please do not jump in blindly. Manage risk!
-TD

Bullish momentum to extend?The US Dollar Index (DXY) is declining toward the pivot level, which serves as an overlap support zone, and may rebound toward the 1st resistance.
Pivot: 98.29
1st Support: 97.14
1st Resistance: 101.91
Disclaimer:
The above opinions given constitute general market commentary, and do not constitute the opinion or advice of IC Markets or any form of personal or investment advice.
Any opinions, news, research, analyses, prices, other information, or links to third-party sites contained on this website are provided on an "as-is" basis, are intended only to be informative, is not an advice nor a recommendation, nor research, or a record of our trading prices, or an offer of, or solicitation for a transaction in any financial instrument and thus should not be treated as such. The information provided does not involve any specific investment objectives, financial situation and needs of any specific person who may receive it. Please be aware, that past performance is not a reliable indicator of future performance and/or results. Past Performance or Forward-looking scenarios based upon the reasonable beliefs of the third-party provider are not a guarantee of future performance. Actual results may differ materially from those anticipated in forward-looking or past performance statements. IC Markets makes no representation or warranty and assumes no liability as to the accuracy or completeness of the information provided, nor any loss arising from any investment based on a recommendation, forecast or any information supplied by any third-party.

US Dollar: Buy The Rally!Welcome back to the Weekly Forex Forecast for the week of Nov. 10-14th
In this video, we will analyze the following FX market: USD Dollar
The USD is in a pullback... that I believe is ending. Buying is the best bet! Once price gives the signature of a market shift from bearish to bullish, buys are valid!
Enjoy!
May profits be upon you.
Leave any questions or comments in the comment section.
I appreciate any feedback from my viewers!
Disclaimer:
I do not provide personal investment advice and I am not a qualified licensed investment advisor.
All information found here, including any ideas, opinions, views, predictions, forecasts, commentaries, suggestions, expressed or implied herein, are for informational, entertainment or educational purposes only and should not be construed as personal investment advice. While the information provided is believed to be accurate, it may include errors or inaccuracies.
I will not and cannot be held liable for any actions you take as a result of anything you read here.
Conduct your own due diligence, or consult a licensed financial advisor or broker before making any and all investment decisions. Any investments, trades, speculations, or decisions made on the basis of any information found on this channel, expressed or implied herein, are committed at your own risk, financial or otherwise.

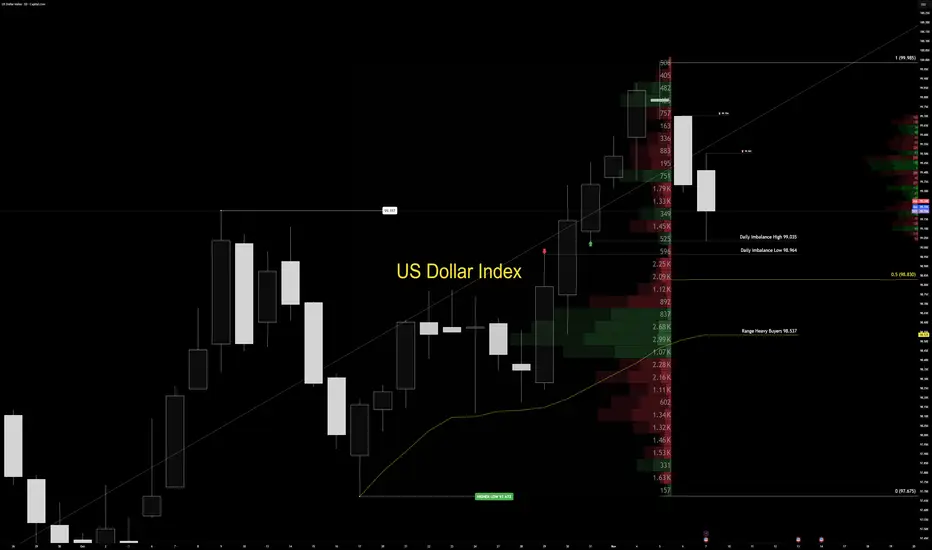
Sunday Dollar War Map | Week Ahead — DXY Structure OutlookThe US Dollar Index (DXY) continues to trade within a controlled bullish range, holding the upper half of its daily structure between 97.675 (range low) and 99.985 (range high). Price remains anchored inside premium territory, with a daily imbalance cap defined between 99.035 (high) and 98.964 (low).
Volume delta stays concentrated deep in the discount zone near 98.537, showing that institutional participation remains limited. Early in the week, price may probe deeper into that imbalance cap to trigger larger positioning before any directional expansion. Until confirmed volume steps in, the tactical stance remains clear: observe, don’t predict. Professionals wait for conviction — amateurs try to guess it.
The active order flow imbalance remains unfilled, and price typically reacts once single prints inside that imbalance get touched. However, the heavy volume concentration across the lower half of the range deserves attention — trading directly into the cap often causes reactive blowback. That’s not random; it’s how market maker logic plays out through volume flow behavior.
On the macro side, US yields continue to climb as investors demand higher compensation for duration risk. The 10-year Treasury yield hovers near 4.1%, while the 30-year sits close to 4.7%. Meanwhile, fiscal pressure continues to build — record government debt and renewed shutdown risks are keeping confidence fragile.
The outcome is a balancing act: rising yields support the dollar in the short term, while long-term credibility remains under pressure. For now, the dollar holds its ground — but each move is conditional.
Professionals trade participation, not prediction. The market doesn’t reward speed — it rewards confirmation. Let the tape show its hand before you show yours. Structure speaks first. Volume decides who listens.
— Institutional Logic. Modern Technology. Real Freedom.
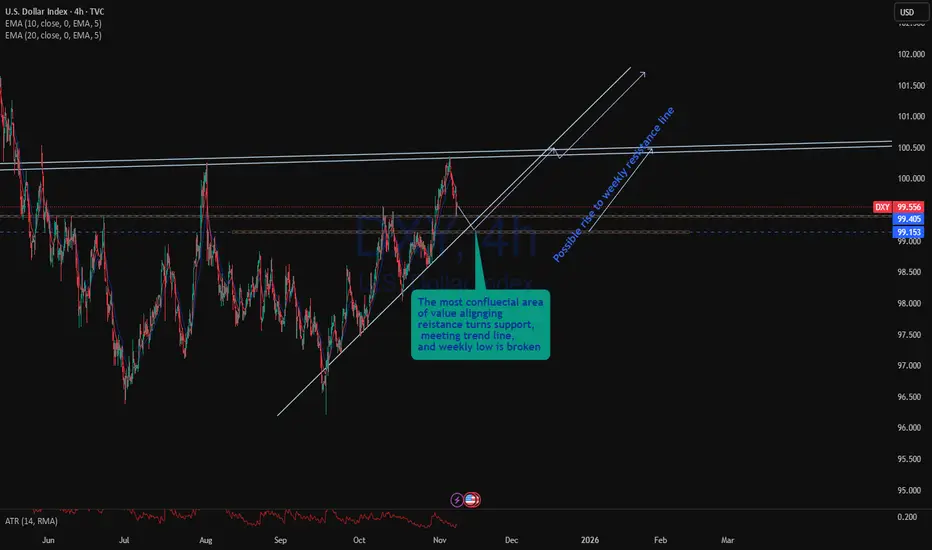
DXY is approaching a very area of value!As the US government shudtown started along with DXY's bullish trend is continuing except past weeks, needed pullback. with price formed a weekly pin par, which could bring early this week price to further down and, which may approach the most confluenced point of 99.15 which is the previous reistance turn support leading a possible buy zone for trend continuation.
Aligning 3 high confluence of
1. Trend line
2. Resistance turns support and
3. weekly low
upon price action rejection, and reversal confirmation to bullish it is a probability bullish market.
DXY : This Up Wave Won’t Last Long!The U.S. Dollar Index has made a corrective push up, but momentum looks weak. Structure suggests this “up wave” could soon fade, paving the way for another bearish move. Watch closely a potential reversal could be near!
Disclosure: We are part of Trade Nation's Influencer program and receive a monthly fee for using their TradingView charts in our analysis.*
