DXY: Dollar Index Mid-Term OutlookThe U.S. Dollar Index is maintaining a steady corrective rhythm on the 4-hour timeframe, with recent price behaviour indicating a potential shift in momentum as markets transition into December. Current swings highlight an evolving structure where buyers and sellers continue to balance out ahead of key macro catalysts.
Disclosure: We are part of Trade Nation's Influencer program and receive a monthly fee for using their TradingView charts in our analysis.
Market insights

Weekly WatchlistThe dollar index has been in a **short-term upward cycle for almost 75 days**, and now it’s moving toward the **100 level**, which is a very strong resistance. This week we need to see whether it can:
1. **Break this resistance**, and
2. **Hold above 100** (give a proper consolidation)
If these two conditions are met, we can say the **DXY has turned bullish**.
If that happens, **many currency pairs, gold, and even crypto** could come under strong downward pressure, because a stronger dollar usually pushes these markets lower.
But if the 100 level rejects the price, then a pullback or reversal is likely.

DXY – Expected Move / Trade Idea (Revised)
## **📌 DXY – Expected Move / Trade Idea (Revised)**
The weekly structure is showing that the market has already taken liquidity from the previous highs more than once. Every time price pushed upward, it quickly rejected and closed lower. This usually signals that buyers are weakening and the market is only sweeping liquidity before moving in the opposite direction.
---
## **1) Weekly Behaviour**
* Multiple liquidity grabs at the top
* Strong wicks and weak closes
* Momentum slowing down on the upside
All of this suggests that the recent upward movement wasn’t genuine strength, but simply a cleanup of resting buy-side liquidity.
---
## **2) Current Position of Price**
Price is sitting just above a weekly fair value gap. This area can still create a small reaction upward, but it looks more like a temporary correction rather than a shift into a bullish trend.
---
## **3) Expected Path**
The market may rise slightly from here to trap late buyers, then lose strength again as soon as it completes the corrective move.
Once that reaction is done, the chart points towards a much bigger continuation to the downside. The overall higher-timeframe structure supports this direction:
* Liquidity has been taken from the top
* Market remains in a lower-low cycle
* A deeper imbalance below still needs to be filled
---
## **4) Main Bias**
The larger story remains bearish.
Short-term movement might look bullish, but the real expansion is expected to develop downward after the correction completes.
There is a major draw on liquidity sitting much lower, and the weekly structure is naturally being pulled toward that level.
---
## **✔ Final Thoughts**
In simple words, the dollar looks ready for a classic move:
**A small correction upward → liquidity trap → major continuation downward.**
If you want, I can also prepare a clean entry model or a trading-plan-friendly version of this analysis.

$DXY / Dollar - History RhymingDon't look now, but the dollar giving December 2024 vibes 👀
- Slow Stochastic above 80
- Consistent rejection from weekly supply/resistance level
- 4th quarter Santa rally confirmed? 🎅🏽

DXY 4H Outlook: Demand Zone Reaction & Bullish Potential
📊 USD Index (DXY) – 4H Market Outlook
The market is currently reacting to a key demand zone, aligning with structural and liquidity factors that suggest a potential bullish continuation if confirmation appears.
---
📌 Market Structure
After forming the previous top, price shifted into a corrective phase and created a bearish BOS, followed by a minor CHoCH to the upside.
This signals that the market may be developing a short-term bottom inside the demand zone.
---
📌 Key Demand Zone
Price has tapped a strong demand area that aligns with:
The 0.786 Fibonacci retracement
Previous liquidity sweep beneath recent lows
Historical reaction zone
This confluence increases the probability of a bullish reaction.
---
📈 Bullish Scenario (Primary Expectation)
If buyers hold this demand zone and we see clear confirmation on lower timeframes (CHoCH/BOS + impulsive candles), price may target the following levels:
🎯 Targets
TP1: 100.013 — first minor supply
TP2: 100.500 — major liquidity zone
TP3: 101.400 – 101.500 — higher-timeframe supply and final objective
A move toward TP2 is likely if bullish momentum strengthens.
---
📉 Bearish Scenario (Alternative)
If the demand fails and price closes decisively below 98.6, the bullish setup becomes invalid.
In that case, price may revisit:
97.90
97.30
These areas hold liquidity and past structural reactions.
---
📥 Entry Approach
Conservative Entry: Wait for a lower-timeframe CHoCH + bullish confirmation inside or above the demand zone.
Aggressive Entry: Enter within the demand zone, but proper risk management is crucial.
---
🔒 Stop Loss
Below 98.60
A 4H close beneath this region invalidates the long setup.

DXY (US Dollar Index) – 4H Trendline Structure AnalysisThe Dollar Index continues to trade below the major red trendline, confirming sustained bearish structure on the 4H timeframe. Recent candles show repeated rejections around 99.54, indicating that buyers are failing to regain momentum.
With price now moving underneath both the diagonal trendline and the horizontal zone, bearish continuation remains the most probable scenario. As long as DXY stays below 99.54, momentum favors downward movement toward the next liquidity pockets.
The nearest support sits at 99.24, which aligns with the mid-range level from earlier sessions. A break and close beneath this zone opens the path toward 98.99, followed by 98.81 — both key areas of historical reaction and volatility.
The broader structure keeps the index under pressure until a confirmed candle close above the red trendline shifts momentum back to the upside.
Structure Summary:
Below red trendline → bearish pressure remains active
Immediate support → 99.24
Next downside targets → 98.99 and 98.81
Close above 99.54 would weaken this bearish scenario
The bearish continuation remains valid as long as DXY respects the trendline and fails to reclaim 99.54.
— Avo.Trades

USD - A Month of Resistance at Prior SupportThe 100.22 level continues to be a massive spot on the DXY chart. Bulls have been in control ever since the Fed started cutting rates in September and that's similar to last year. But, unlike last year, buyers haven't been able to extend the breakout as its been a more grinding affair so far this Q4. Notably, however, bulls aren't yet out of it.
The 100.22 level first came back into play on August 1st before reversal showed around the NFP release. But it was back in the picture in early-November. At the time, EUR/USD had started to re-test the 1.1500 handle and GBP/USD had plunged with its weakest RSI read on the daily chart in more than two years.
But in DXY, support held at a major spot - 98.98, which is the 61.8% Fibonacci retracement of the 2021-2022 move. This led to another bounce and another test of 100.22.
For this round, the level was tested for five consecutive days into this week, until sellers were finally able to provoke pullback. But, so far, bears haven't been able to get below the recent higher-low so there's still a claim to bullish structure on the daily, and that aligns well with the bearish backdrop on daily EUR/USD.
For shorter-term support, we're seeing a familiar level back in the mix at 99.40, helped to set the highs back in June.
If looking for USD-weakness, GBP/USD can be compelling. For USD-strength, USD/JPY is more attractive currently. And for both EUR/USD and USD, it's that 1.1500 level in the major pair that stands out as significant. - js

Long-term analysis of the Dollar Index on the weekly timeframeAbout 320 days ago, the decline of the Dollar Index below the 100 level began, and it has continued up to today. During this period, due to various political events, the index has remained stuck below the 100 zone, and although it has attempted several times to break above it, each attempt has been rejected.
Right now, the index appears to be in a decision-making zone. If you look at the curved resistance line, you can see that price has reached a compression point at the end of that curve. These kinds of compressions that form after long periods of indecision act like a time bomb — they can explode in either direction at any moment.
Our goal is not prediction — we are not fortune-tellers — but based on the signals we have, we can determine whether the probability of moving up or down is higher. The current chart structure suggests that the index may be preparing to break that resistance and confirm above it. If that happens, all markets will be affected. Many of the bullish and bearish moves we’ve recently seen across markets — including crypto — will react strongly.
That’s why we should always keep an eye on this chart. This resistance level is important and will determine the direction of many things.

What should we expect from DXY Index by the end of 2023❗️❓🗺️👋Hi everyone (Reading time less than 3 minutes⏰) .
📚One of the most important Indices that we should have an analysis of is the DXY index because it has a direct impact on the Forex , Cryptocurrency , and stock and etc markets. So, in this post, I'm going to show you the 🗺️ Roadmap 🗺️ for DXY until at least the End of 2023 and Early 2024 .
💡I used the Monthly time frame and Elliott wave theory to display the DXY index roadmap better.
💡First of all, it is better to know that the DXY index has formed an Ascending Channel since 2008 and is moving in it.
🌊According to the theory of Elliott waves , the DXY index has succeeded in completing its 5 impulsive waves in the ascending channel so that the 3rd wave was an extended wave .
🌊As a result, it seems that Corrective waves have started, and to confirm this, it is better to wait for the break of the lower line of the ascending channel.
🔔I expect the DXY to move between 🔴Heavy Resistance zone($107.62-$103.10)🔴 and 🟢Support zone($101.64-$99.58)🟢 by the end of 2023 and early 2024, and in mid-2024 , the DXY will begin to trend Down , and Financial markets will likely turn 🚀Green🚀 .
DXY Index Analyze ( DXYUSD ), Monthly time frame ⏰.
Do not forget to put Stop loss for your positions (For every position you want to open).
Please follow your strategy; this is just my Idea, and I will be glad to see your ideas in this post.
Please do not forget the ✅' like '✅ button 🙏😊 & Share it with your friends; thanks, and Trade safe.

DXY bottomed and is starting the new Bullish Leg.The U.S. Dollar index (DXY) has been trading within a Channel Up since the October 01 Low last week even broke above its 1D MA200 (orange trend-line) for the first time since March 05 2025.
Technically, that is confirmation for the long-term continuation of the uptrend. As long as the 1D MA50 (blue trend-line) holds, we expect DXY to start the new Bullish Leg of the Channel Up as yesterday it hits its bottom.
There is a high symmetry between the last three Bullish Legs but since the 'weakest' one has been +2.17%, we have a Target at 101.100. As you can see, that would even test the 1W MA50 (red trend-line), which is the natural long-term Resistance of the market.
Notice also the 1D RSI bounce on its 2-month Support Zone as well as the just formed Bullish Cross on the 4H MACD. All perfectly aligned with bottom formations signaling buy opportunities.
---
** Please LIKE 👍, FOLLOW ✅, SHARE 🙌 and COMMENT ✍ if you enjoy this idea! Also share your ideas and charts in the comments section below! This is best way to keep it relevant, support us, keep the content here free and allow the idea to reach as many people as possible. **
---
💸💸💸💸💸💸
👇 👇 👇 👇 👇 👇

uptrend The uptrend is expected to continue to the identified resistance levels. Then there is a possibility of a trend change. A triangle pattern is expected to form and then the start of an uptrend is likely.

$DXYTVC:DXY pulled back into a major transaction zone that’s where big money adjusts positions.
A cheaper dollar opens the door for liquidity to rotate back into risk assets.
That’s why we’re seeing stronger CRYPTOCAP:BTC flows.
Dollar down = crypto gets room to breathe.

US DOLLAR INDEX In my view, the US dollar index finish the motive wave and will start down trend. the target for sell position is 106.15.

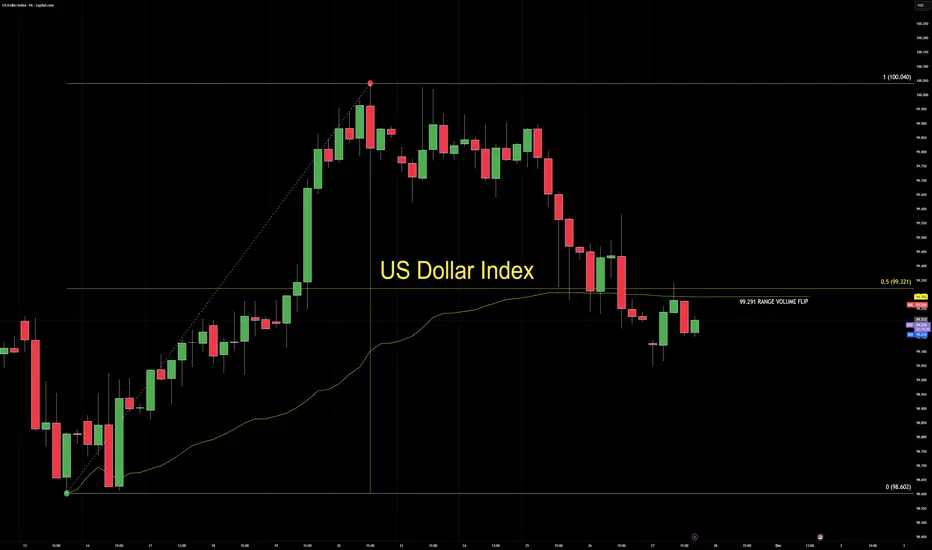
US DOLLAR UPDATEDollar is trading in the discount of the daily bullish range, losing momentum, and flipping the range volume node bearish at 99.291.
Range 98.602 → 100.040.
1. DRIVERS
Softening Dollar with fading participation.
2. STRUCTURE
Discount test with weak rotation.
Bearish node flip shows shifting participation, not a macro break.
3. IMPLICATION
Range location doesn’t confirm a flush.
Cross-market rally only forms when yields, risk tone, and correlations align.
4. CORE5 PILLARS
MSM: discount test
DGM: momentum fading
VFA: bearish flip at 99.291
OFD: no strong absorption
PEM: wait for confirmation
5. TAKEAWAY
This is a probe, not a confirmed reversal.
— CORE5DAN
Institutional Logic. Modern Technology. Real Freedom.
NOV.23,2025 ANALYSIS- DXY, BTC, NAS100, SPX500, XAUUSD & XAGUSDDXY CAUTION: at weekly resistance but Uptrend with a huge bullish candle suggests continuation to the upside. I expect some sideway price action potential pullback to 99.365 level and then continuation to the upside target of 100.608. A break below 99.365 will invalidate upside targets.
BITCOIN: STILL BEARISH, All my initial bearish targets from previous analysis got smashed. BTC is now in a new bearish territory only finding support at the fib extension 1.618 from the $126,296 high. RSI is very oversold and potentially there could be a sideways price action around this level re-testing $80,524 this week. Ultimately the next bearish target is between $70k and $78k.
NAS100 & SPX500 BEARISH: Both indices closed with a strong bearish candle but found support around their 21EMA on the weekly chart. I observed some unconfirmed hidden divergence plus daily stochastics cycle lows so I expect some sideways consolidation and next leg down to targets of about $23,169 for Nas100 and $6,418 for SPX500.
GOLD & SILVER SIDEWAYS: Gold on the weekly chart showed only a doji candle consolidating price action but lower high of($4,194) confirmed on the chart. I envisage that this consolidation will continue into next week and finally breakdown to the $3,826 target. Silver has maintained the double tops on the weekly and daily charts. The lower high of $52.98 also suggest more downside price action with the initial target of $45 - $47 zone.
I hope my publications are helpful to your own analysis and perspective. Thank you and please show your support for these analysis with a boost or comment so it's shown to other traders. Have a great and profitable trading week and remember risk management is your first job as a trader. Cheers!!

Bullish bounce off?US Dollar Index (DXY) is reacting off the pivot, which acts as a pullback support and could bounce to the 1st resistance.
Pivot: 99.54
1st Support: 98.89
1st Resistance: 101.35
Disclaimer:
The opinions given above constitute general market commentary and do not constitute the opinion or advice of IC Markets or any form of personal or investment advice.
Any opinions, news, research, analyses, prices, other information, or links to third-party sites contained on this website are provided on an "as-is" basis, are intended to be informative only, and are not advice, a recommendation, research, a record of our trading prices, an offer of, or solicitation for, a transaction in any financial instrument and thus should not be treated as such. The information provided does not involve any specific investment objectives, financial situation, or needs of any specific person who may receive it. Please be aware that past performance is not a reliable indicator of future performance and/or results. Past performance or forward-looking scenarios based upon the reasonable beliefs of the third-party provider are not a guarantee of future performance. Actual results may differ materially from those anticipated in forward-looking or past performance statements. IC Markets makes no representation or warranty and assumes no liability as to the accuracy or completeness of the information provided, nor any loss arising from any investment based on a recommendation, forecast, or any information supplied by any third party.

DOLLAR INDEX SHORT SETUP Price formed a double top on the resistance, semi confirming a failed break above it. However the channel is still upwards. Safe entries after break below the uptrend channel

Dxyits long term analysis as next dxy move.
my predicyion is clear and 97.00 is my target.
this is H10 time frame ,that i chose to describe all important areas that you can use when will broke.
98.79 , 98.04 are the most important price that i consider as stopstations

DXY and other currency indices - midweek analysisWith the current rate-cut expectations, the DXY shows weakness:
DXY Structure:
- Massive decline from 110+ highs (Jan 2025) to current 99.50
- Trading BELOW 100 => psychological weakness
- Recent rejection from 100.25 resistance
Immediate Outlook:
- Below 100 = USD weakness confirmed
- If breaks below 99.00 → accelerate down to 98.00
- Only bullish above 100.50
Expectation: Consolidation and further decrease to 99 area
Summary after checking 4H and daily charts of further big currency indices
EURX
Bias: BULLISH ✅✅✅
Immediate Outlook:
- Extremely bullish, at all-time highs
- Any dip to 1,090-1,092 = buying opportunity on EUR/XXX pairs
- Target 1,096-1,098 if breaks above
BXY
Bias: NEUTRAL 🟡
Immediate Outlook:
- Choppy, range-bound
- 130.00 = strong support
- 137.00 = strong resistance
- Wait for breakout, currently no good trade opportunities on GBP/XXX pairs
JPYBASKET
Bias: BEARISH ❌❌❌ (WEAKEST)
Immediate Outlook:
- JPY extremely weak at multi-year lows
- Any bounce = counter-trend
- Resistance at 5,850-5,880
- Weakest major currency → shorting opportunity on XXX/JPY pairs
CXY
Bias: BEARISH (but at support) ⚠️
Immediate Outlook:
- At critical support 71.20
- Bounce possible but weak overall
- If breaks 71.00 → accelerate lower
- Bearish bias but watch for bounce → short-term long opportunity on XXX/CAD pairs
AXY
Bias: NEUTRAL-to-BEARISH 🟡⚠️
Immediate Outlook:
Range-bound with slight bearish bias
- 64.00 = critical support
- Neutral until break of range, if critical support breaks → short opportunity on XXX/AUD pairs
CRITICAL PRICE ZONES TO WATCH (higher timeframes)
For USD:
- Below 99.00 = Major USD weakness → Buy EUR/USD, EUR/JPY aggressively
- Above 100.50 = USD strength return → Reconsider USD shorts
For EUR:
- Below 1,090 = EUR pullback → Buying opportunity
- Above 1,096 = EUR breakout → Chase longs
For JPY:
- Below 5,680 = Extreme JPY weakness → Aggressive JPY shorts
- Above 5,850 = JPY bounce → Take profits on JPY shorts
For AUD:
- Below 64.00 = AUD breakdown → Short AUD aggressively (EUR/AUD longs)
- Above 66.00 = AUD strength → Consider AUD longs
For GBP:
- Below 130.00 = GBP breakdown → Short GBP
- Above 135.00 = GBP strength → Long GBP
For CAD:
- Below 71.00 = CAD weakness → Short CAD
- Above 72.50 = CAD bounce → Long CAD

EU SH+PLEU market activating a fresh significant HnL resistance, DXY approaching a support line. A bit early entry, will FOMO backfire?

bullish dxy stillIN the mean time, looks like we found demand here on h4 .
pretty much still bullish

Dollar Index Nears Critical Elliott Wave ThresholdThe U.S. Dollar Index is pressing into a decisive stage of its long-developing Elliott Wave structure, with price action now testing levels that could determine whether the broader trend resumes upward or unfolds into a deeper corrective phase.
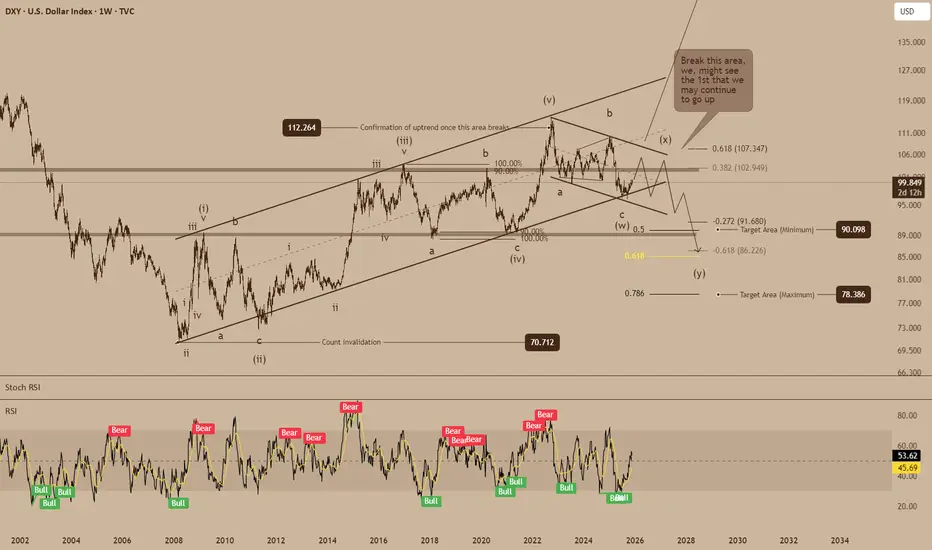
The multi-year count shows the 2022 high likely completed a major Wave (v) of a larger impulsive cycle, after which the DXY has been tracing a complex corrective structure. The current form, an overlapping sequence of a-b-c subdivisions followed by a W-X-Y formation, suggests the dollar remains in the latter phases of a higher-degree correction rather than a fresh impulsive advance.
The key resistance band between 102 and 108 holds outsized importance in this context. A sustained break above this zone would invalidate the preferred bearish count, signaling that the correction terminated earlier than expected and that a new primary impulsive sequence upward may already be underway. Such a breakout would mark the first structural evidence of a renewed Wave (i)–(ii) base forming beneath the surface.
However, unless that confirmation arrives, the corrective interpretation remains dominant. The overlapping waves, declining momentum, and symmetry of the broader pattern point toward a final Wave (y) still incomplete. The projected termination region for this move, roughly the 91.50 to 86.20 zone aligns with Fibonacci 0.272 and 0.618 extensions, providing both proportional balance and historical confluence typical of higher-degree Wave Y endpoints.
Invalidation levels are clearly defined: a decisive move above the upper boundary of the multi-year channel and above 112.26 would conclusively negate the bearish corrective outlook and establish the beginning of a new impulsive cycle.
Until then, the Elliott Wave roadmap continues to favor a final downward sequence before the long-term structural reset is complete.
DXY SELLING FASTDxy has found a resistance at 100.000 and created a double top.
i am pretty confident we're headed down..
trade red daily candles
