NQ Out of Woods? "New High - New Low" 20D still wrestling 50D Vertical Blue Lines = Sell Signal when 20D EMA below 0
Vertical Green Lines: Absolute Low of the correction
Vertical Yellow LInes = Buy Signal: 20D above 50D EMA

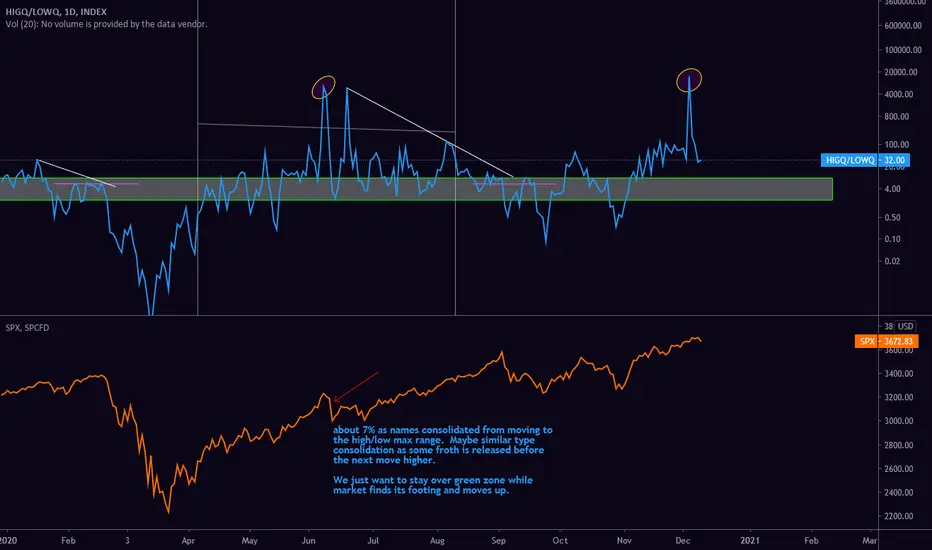
woofattempt of timing a top...as dumb as that sounds in this market. But something to keep eye on if this breaks todays low and that pink line on high/low...

Bear Market Bottom Indicator (Possibly)One of the methods to identifying market bottoms is to look at 52 week Highs and Lows. These are charts of New Highs and New Lows. For New Highs, the expansion seems to come well after the market bottom is put into place, so I wanted to map the trend of New Highs. I've found the Hull Moving Average

See all ideas
Displays a symbol's price movements over previous years to identify recurring trends.