Whale knows the flow - let's follow and ride the flow!210825
Hello bellooo everyone!
From previous update, HSI uptrend mode is still on track.
Currently is on retracement mode. IMO It is not turning bear.
At point of writing ✍️:
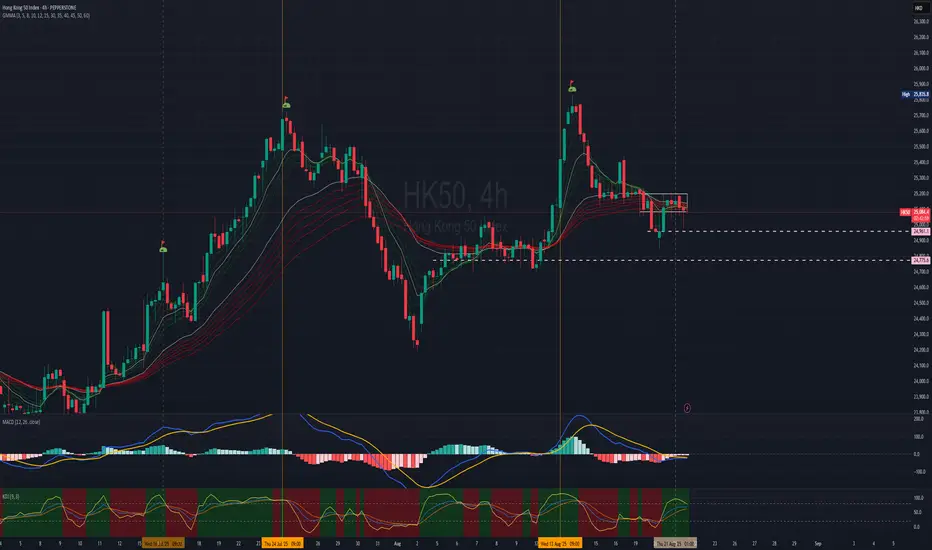
the HK50 $PEPPERSTONE 4H chart is undecisive - likely ranging between 25200-25096.
It seems going to test the support level at 24961 & 24772.
MACD line and signal below zerol level and KDJ although in greenzone but the trendline is cupping down.
Be cautious and monitor for shorter tf Long as it could take a while to rebound.
For aggressive entry, you may take Long/Short position within the range and set SL.
Otherwise you may wait for confirmation (depends on your time frame of trade).
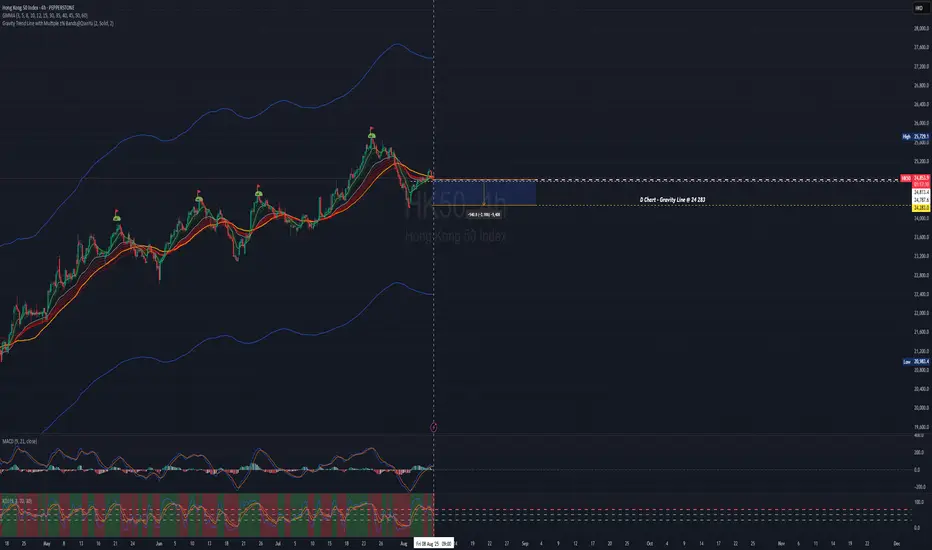
currently on D Chart -
🗝️ Resistance Level : 25150
Support Level : 24,950
Support level 24,862 (EMA30)
🗝️ Strong Support Level : 24,609 (from 24120 @1Aug25, Gravity TrendLine support lifting circa 490pts)
Higher Hi⛳ marked in D Chart HK50 $PEPPERSTONE
21May2025 -23909
11June2025 -24430
25June2025 -24531
16Jul2025 - 24842
24Jul2025 - 25729
13Aug2025 - 25835
?? ??2025 - 26713 Next Hi
Notice the trend, after the ⛳ , retraced back to Gravity Trend Line area,
GMMA squeezing again (from last update on 8Aug25) before it spreading out again for bullish trend.
Well it's quite predictable the movement of the Index like 🌊 it's completing its cycle for the next big wave to form.
Nothing complicated.
Be aware, following your own tradeplan/SOP.
Take your position, setting stop loss and ride on the trend (up/down).
The HSI Index
At point of writing ✍️
Index is being sucked towards to D GravityLine again - 24665 (a lift from 8Aug2025 GravityTrendLine at 24344. Still in uptrend
🗝️ Next Resistance Level : 25300
🗝️ Next Support Level : 24970
🗝️ Strong Support Level : 24920 (EMA30)
www.tradingview.com
The 🐳 (institution including hedge funds, mutual funds, and private funds) likely is accumulating.
Probably they are 'selling' the news.
IMO:when HSI touch the EMA30/GravityTrendLine and overall is on uptrend mode, it's a healthy pullback/retracement and without hesitation very much would like to follow the 🐳 to accumulate.
Trade from awareness, not from noise. Trade with ease.
** Please Boost 🚀, FOLLOW ✅, SHARE 🙌 and COMMENT ✍ if you enjoy this idea!
Share your trading journey here to encourage the community and friends who pursing the same journey.
This is for educational and reference purposes only.
It does not constitute financial advice or a recommendation to buy or sell any financial instrument.
Always perform your own due diligence and consult a licensed financial advisor before making investment decisions.
HSI trade ideas
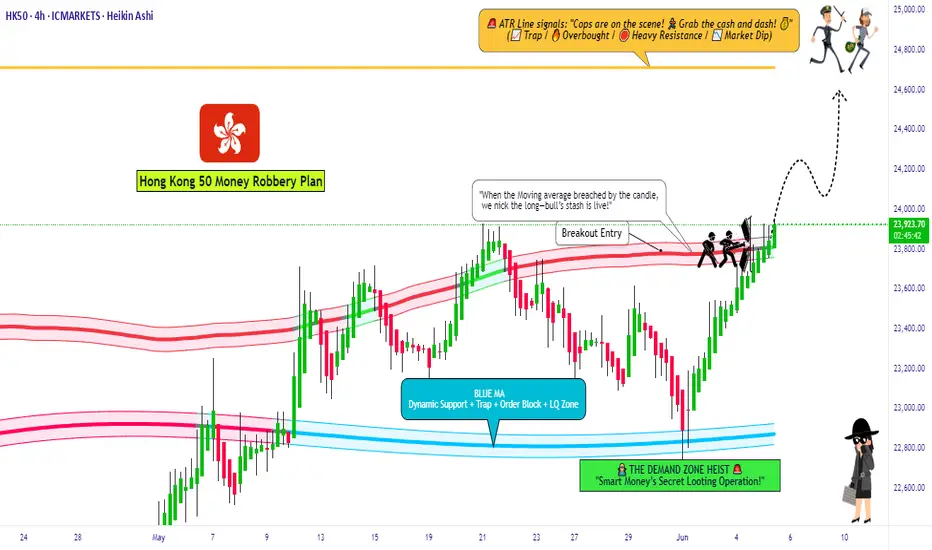
Who’s Ready to Rob HK50? Bullish Pullback Strategy!🚨 HK50 "HongKong" Index Market Bullish Robbery 🚨
Dear Ladies & Gentlemen (Thief OG’s) 🕶️💼💰,
We got a big score lined up in the Hong Kong Index (HK50) – and this time, the vault doors are wide open! 🔓💸 Our crew is preparing a Bullish Swing Trade Heist – but remember, every robbery needs patience, timing, and a clean exit.
🎯 Heist Blueprint (Plan)
Entry Points (Pullback Entries) 🏦
Entry 1: 24,800.00 💎
Entry 2: 24,400.00 💎
Stop Loss (Escape Routes) 🏃♂️🚪
SL for Entry 1: 24,500.00
SL for Entry 2: 24,000.00
👉 Thieves adjust SLs based on your own risk tolerance & strategy – no one-size-fits-all in the game.
Target (Cashout Before Police Arrive) 🚔💰
26,000.00 – take the loot & disappear before the barricades shut us down! 🏆💸
📌 Thief Notes
This is a layered pullback entry plan (stacking orders like stashing cash 💵).
Don’t be greedy – the police (market makers) will chase late robbers. ⚠️
Manage your lot size like a pro thief – precision > panic.
💖 If this robbery plan gets you hyped, smash that Boost Button 🚀💥 – it strengthens our crew and spreads the Thief Trading Style across the TradingView underground!
Stay sharp, robbers 🕶️💼 – we steal, we escape, and we live to rob another day. 🐱👤

China: Hang Seng Sneaks HigherChina has seen its share of headline risk this year, and now some traders may think a breakout is coming in the key Hang Seng index.
The first pattern on today’s chart is the July 24 peak above 25,700. It was the highest price since late 2021, which may suggest buyers are active.
Second is the series of higher lows (and higher highs) since April. That may reflect an emerging uptrend.
Third is June 25’s closing price of 24,475. It began August by pulling back to hold that level. Has old resistance become new support?
Fourth, Bollinger BandWidth has narrowed during the period of consolidation. Could that price compression give way to expansion?
Finally, moving averages may indicate uptrends in the short and long terms. The 8-day exponential moving average (EMA) is above the 21-day EMA, and the 100-day simple moving average (SMA) is above the 200-day SMA.
TradeStation has, for decades, advanced the trading industry, providing access to stocks, options and futures. If you're born to trade, we could be for you. See our Overview for more.
Past performance, whether actual or indicated by historical tests of strategies, is no guarantee of future performance or success. There is a possibility that you may sustain a loss equal to or greater than your entire investment regardless of which asset class you trade (equities, options or futures); therefore, you should not invest or risk money that you cannot afford to lose. Online trading is not suitable for all investors. View the document titled Characteristics and Risks of Standardized Options at www.TradeStation.com . Before trading any asset class, customers must read the relevant risk disclosure statements on www.TradeStation.com . System access and trade placement and execution may be delayed or fail due to market volatility and volume, quote delays, system and software errors, Internet traffic, outages and other factors.
Securities and futures trading is offered to self-directed customers by TradeStation Securities, Inc., a broker-dealer registered with the Securities and Exchange Commission and a futures commission merchant licensed with the Commodity Futures Trading Commission). TradeStation Securities is a member of the Financial Industry Regulatory Authority, the National Futures Association, and a number of exchanges.
TradeStation Securities, Inc. and TradeStation Technologies, Inc. are each wholly owned subsidiaries of TradeStation Group, Inc., both operating, and providing products and services, under the TradeStation brand and trademark. When applying for, or purchasing, accounts, subscriptions, products and services, it is important that you know which company you will be dealing with. Visit www.TradeStation.com for further important information explaining what this means.

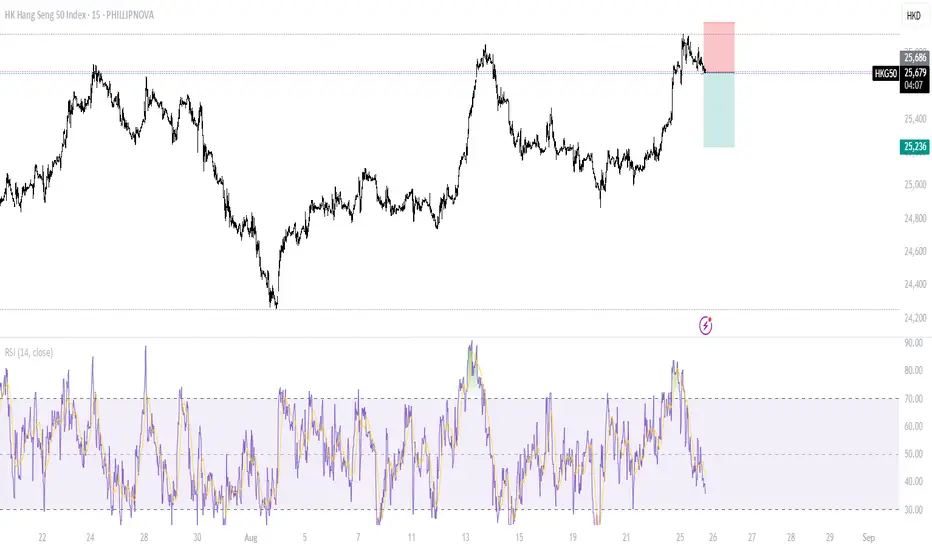
Hang Seng Index Pulls Back from 2025 HighHang Seng Index Pulls Back from 2025 High
Yesterday, the Hong Kong Hang Seng Index (Hong Kong 50 on FXOpen) climbed above 25,745 points, setting a new 2025 high — and marking its highest level since autumn 2021.
August’s bullish sentiment was fuelled by the following drivers:
→ China and the US agreed to continue tariff negotiations in mutual trade through to November.
→ Citi analysts noted that the implementation of additional demand-stimulus measures in China is progressing as planned.
→ According to Reuters, investor interest in China’s technology sector is increasing.
However, today the Hang Seng is trading lower, suggesting that yesterday’s optimism is gradually fading.
Technical Analysis of the Hang Seng Index
Price action continues to form an upward channel (shown in blue), with the index currently trading near its median line — an area where supply and demand tend to balance. This indicates that the Hang Seng may enter a consolidation phase.
That said, several bearish signals suggest the pullback from the 2025 peak in the Hang Seng Index (Hong Kong 50 on FXOpen) could extend:
→ The breakout above the July high was minimal in both progress and duration. The swift reversal after a brief rise is typical of a false bullish breakout, indicating fragile demand.
→ Today, two relatively long bearish candles have closed near their lows — a sign of increasing selling pressure.
→ The MACD histogram remains above zero but is declining — a pattern often seen when price exits overbought territory.
Potential Support Levels in a Correction Scenario:
→ 50% Fibonacci retracement (around 25,295);
→ 25,180 – marked by an explosive price surge and resistance breakout (as indicated by the arrow), signalling strong buyer dominance;
→ The 25,000 psychological level and the lower boundary of the channel — although, in this case, the depth of the decline would call into question whether this is merely a correction or the start of a longer-term downtrend.
This article represents the opinion of the Companies operating under the FXOpen brand only. It is not to be construed as an offer, solicitation, or recommendation with respect to products and services provided by the Companies operating under the FXOpen brand, nor is it to be considered financial advice.

Indexes Pull Back – Is This the Entry You Missed? | SPX500 & HK5Most major indexes like SPX500 and HK50 have retraced about 50% of their recent gains, giving a second chance to those who missed the previous leg up. In this episode, I break down key support zones and share simple, high-probability triggers—range breakouts, engulfing candles, and fakeouts—to spot momentum shifts. 🔍
📍Remember: follow the trend, manage your risk, and no shorting here as it goes against HWC/MWC bias.
( Educational content only , not financial advice. Comment your favorite ticker for future analysis.)

HKG50Price appears to be overbought, I'm expecting this pair to be in a downtrend really soon, going for 1:1.5 RR.
Hong Kong vs New York: Who Wins the Final Round? | HK50 BreakdowHong Kong vs New York — two giants, two very different charts. In this breakdown, I’ll walk you through the key support/resistance levels on HK50, possible fakeouts, and where the next real trigger might appear. No hype, just a clear look at what’s really happening.

HK50 LONGThere is a bat pattern on M30 and H1 showing a reversal zone
This is with the daily and H4 trend
All timeframes are oversold, but must wait for more consolidation and stronger RSI divergence
Stop loss of 150 pips

HK50 LONGThere is a bat pattern on M30 and H1 showing a reversal zone
This is with the daily and H4 trend
All timeframes are oversold, but must wait for more consolidation and stronger RSI divergence
Stop loss of 150 pips

The Index is at plank mode, be patient then take position.Hello everyone!
From previous update, HSI uptrend mode is still on track.
Previous POV: Deep retracement had happened. From 25,419 retraced to 24250 (circa 3.23% , 812pts). Check the previous post.
For this week and upcoming; looking at shorter time frame for Long entry.
For intraday, swing trade - look out for entry for swing (using shorter tf to entry), you may use Fibo and other indicator whichever you feel comfortable and confident.
At point of writing ✍️: the HK50 $PEPPERSTONE 4H chart is undecisive.
For aggressive entry, you may take Long position and set SL.
Otherwise you may wait for confirmation (depends on your time frame of trade).
currently on D Chart -
🗝️ Resistance Level : 25060 (the recent Hi)
Support Level : 24,787
Support level 24,612 (EMA30)
🗝️ Strong Support Level : 24,283 (from 24048@30Jul25, Gravity Trend Line)
Macroview - Hong Kong Markets continue to be Bullish.
Higher Hi⛳ marked in D Chart HK50 $PEPPERSTONE
21May2025 -23909
11June2025 -24430
25June2025 -24531
16Jul2025 - 24842
24Jul2025 - 25729
?? ??2025 - 26713 Next Hi
Notice the trend, after the ⛳ , retraced back to Gravity Trend Line area, GMMA squeezing before it spreading out again for bullish trend.
Nothing complicated. Pay attention, set up your SOP. Take your position, setting stop loss and ride on the trend.
This applicable to Long and Short position.
The HSI Index
At point of writing ✍️ Index is being sucked towards to D GravityLine - 24344; it reversed to bullish on 5Aug25.
🗝️ Next Resistance Level : 25115
🗝️ Next Support Level : 24826
🗝️ Strong Support Level : 24700 (EMA30)
Let's follow your own zentradingstrategy , continue to trade;
When in doubt, sit. Not every candle needs a response.
— Sometimes, the wisest action is non-action.
Be ease at trading!
** Please Boost 🚀, FOLLOW ✅, SHARE 🙌 and COMMENT ✍ if you enjoy this idea!
Share your trading journey here to encourage the community and friends who pursing the same journey.
This is for educational and reference purposes only. It does not constitute financial advice or a recommendation to buy or sell any financial instrument. Always perform your own due diligence and consult a licensed financial advisor before making investment
HK50 LONG This trade is with the daily trend and the showing the momentum still being very up
There are multiple bat patterns on H1 and M15
This trade is oversold on all timeframes up to H4 and showing divergence
Stop loss of 200 pips

HSI dipping, traders are flipping,stay Zen - Index is yoga-ing!Hello everyone!
Today HK50 PEPPERSTONE:HK50 D open at 25350, Hi:25446 Lo:25164
IMO: Deep retracement is happening with profit taking from futures expiring tomorrow for traders & waiting for catalysts for talks next week.
For 4H - Index moving closer to Gravity Trend Line - look out for entry for swing (using shorter tf to entry).
At point of writing ✍️: the HK50 $PEPPERSTONE uptrend mode is on track and now in the retracing mode.
currently on D Chart -
🗝️ Resistance Level : 25300
Support Level : 24950
Support level 24558 (MA30)
🗝️ Strong Support Level : 24048 (Gravity Trend Line)
1H Chart HK50 $PEPPERSTONE
If today not able to close 25304 (25335 HSI), it's likely a deep retracement.
Shor term pullback -for swing trade and for mid-longer term it's still on bull track. Most likely people profit taking before the HSI futures expires tomorrow.
Macro view - Index continue to be Bullish. Well, markets cooled a bit waiting for details from the ongoing US-China trade talks early August'25.
Higher Hi🚩point marked in Chart HK50 $PEPPERSTONE
21May2025 -23909
11June2025 -24430
25June2025 -24531
16Jul2025 - 24842
18Jul2025 - 25052
24Jul2025 - 25729
?? ??2025 - 26163 Revised Target
The HSI Index HSI:HSI
At point of writing ✍️ Index is being sucked towards to D GravityLine - 24085; it fall below the sideway box.
If it doesn't close above the key support level this week, the deep retracement is happening.
🧨🧨🧨Pay attention and cautious.
🗝️ Next Resistance Level : 25350
🗝️ Next Support Level : 24900-25200
🗝️ Strong Support Level : 24300-24750
Let's follow your own zentradingstrategy , continue to trade; Observe your emotions as you would the clouds—passing, shifting, never you.— Mindfulness helps you respond, not react, in volatile markets and moments.
Be ease at trading!
** Please Boost 🚀, FOLLOW ✅, SHARE 🙌 and COMMENT ✍ if you enjoy this idea!
Share your trading journey here to encourage the community and friends who pursing the same journey.

HK50 Index Robbery Plan – Bulls in Control, Load Up🚨💸💥**HK50 MONEY HEIST ALERT – Thief Trading Style Entry Plan!**💥💸🚨
"Swipe the Trend, Rob the Risk – The Hong Kong Vault is Open!"
🌍🌎Hey there, Global Money Movers, Heist Planners & Market Robbers!🕵️♂️💰
Welcome to another high-stakes operation brought to you by the Thief Trading Style – where strategy meets chaos, and profits are earned with precision. 🏴☠️📊
🎯 Mission Brief: HK50 Index Robbery – Long Entry Blueprint
Based on our exclusive blend of technical & fundamental analysis, the HK50 (Hong Kong Index) is entering the Loot Zone – bullish bias detected and price action confirming a strategic long opportunity. Here's how we execute the plan:
🔓 ENTRY – The Vault is Open!
🎯 Strike anywhere near recent swing lows/highs on the 15m or 30m timeframe.
💡 Ideal Entry Zones: Closest bullish structure or reversal support.
📌 Tip: Set alerts at key reaction zones – timing is the true thief’s edge.
🛑 STOP LOSS – Escape Hatch Point
🛡️ SL placed below nearest swing low on the 4H timeframe (~23640.0).
💡 Adjust based on your risk tolerance, lot size, and trade stacking.
🏁 TARGET – The Getaway Route
🎯 TP zone: ~25200.0
🚀 Optional: Use Trailing SL to maximize robbery exit on spikes or trap fails.
💬 “Escape before target” if market sentiment flips or volatility surges.
🧲 Scalper Alert: Ride the Bull Only!
💵 Scalping allowed on buy side only.
If you’ve got capital power – go direct. Otherwise, join the swing thieves and ride with momentum. 📈💣
🧠 Why Bullish? | Heist Justification
📊 Current momentum supported by:
🔎 Technical Trend Reversal Patterns
📉 ATR exhaustion near previous downside levels
📰 Positive Macro, Global Cues, & Institutional Sentiment
👉 For the full scoop – combine this with:
📰 COT Data & Market Sentiment
🌐 Intermarket & Geopolitical Outlook
📈 Index-Specific & Seasonal Cycle Studies
Stay ahead, rob smart! 💼💼
⚠️ Risk & News Alert – Don’t Get Caught!
🔔 Avoid entries during major news drops!
✅ Use trailing stop-losses on running trades.
🚷 Protect your loot at all costs – market volatility is the real SWAT team! 🚓
💥Support Our Robbery Crew!
📢 Smash the Boost Button 💣💥 to support the Thief Trading Style revolution!
Together, we rob with discipline, plan with clarity, and exit with satisfaction.
💰Let’s stack profits, not just candles. 📈🤑
📝 Disclaimer:
This is a high-level market outlook, not financial advice. Adjust based on your capital, risk tolerance, and analysis. Always monitor your trades and adapt to the ever-changing market landscape.
Follow for more Heist Plans – this is just the beginning! 🕶️🔐
**See you at the next vault…**🚁💼📈
#ThiefTrading #HK50 #MarketHeist #IndexAnalysis #BullishBreakout #SmartMoney #ScalpersWelcome #SwingTrading #TechnicalAnalysis #RiskReward #TradingViewElite #ProfitWithStyle

pull back of HK50 1. bearish BOS
2. after the bearish breakout retest did not go back to the last breakout momentum.
3. tend to sell around 25417 and TP 25212

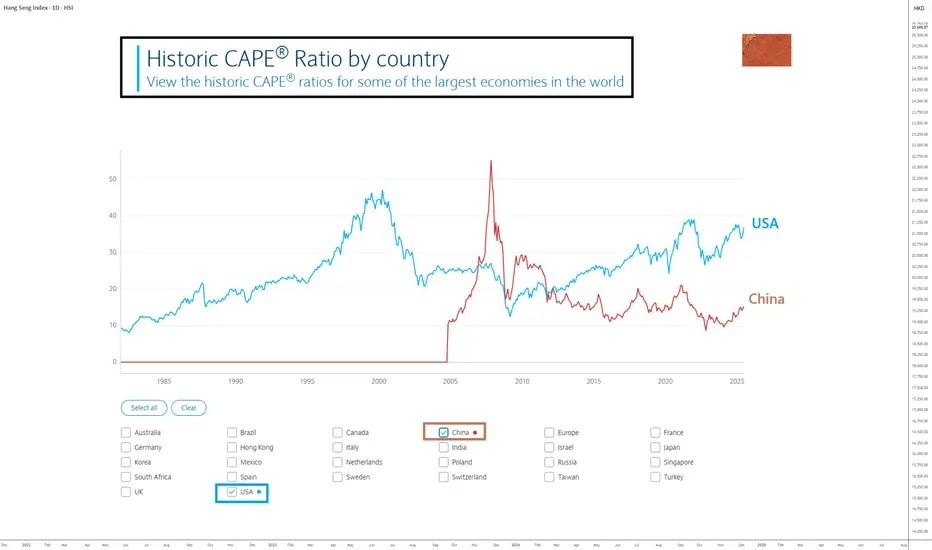
CHINA: Catch-Up Potential Remains AttractiveAs the U.S. stock market trades at all-time highs and has returned to its valuation levels of late 2021 (before the 2022 bear market), it may be wise to look at the Chinese stock market as a way to diversify your portfolio.
Regarding the analysis and potential of the S&P 500 Index, I encourage you to read my latest forward-looking study by clicking on the image below. Don’t forget to subscribe to our Swissquote account to be notified every morning when our new daily market analysis is published.
Let’s now turn back to the Chinese stock market. I believe Chinese equities still offer medium to long-term upside potential, both technically and fundamentally.
1) Strong catch-up potential from a fundamental valuation perspective
The Chinese stock market presents an interesting diversification opportunity from a valuation standpoint, with a Shiller PE ratio (CAPE) of 15 compared to 36 for the S&P 500.
Chinese equities are significantly cheaper than U.S. equities and also benefit from an ultra-accommodative monetary policy from the People's Bank of China and an expansionary fiscal policy by the Chinese government. These are key fundamental factors that support strong upside potential for Chinese equities.
2) From a technical standpoint, the ATH is the natural target for Chinese indices
Focusing on the technical analysis of the Shenzhen Composite Index (weekly chart), the setup is clear: a trading range between support at 7,500 points and resistance at 16,000 points. The market has recently built a bullish reversal pattern at the lower bound, making the upper range the natural technical target.
3) Yuan strengthening in Forex is a positive signal for Chinese equities
Finally, one more factor supports Chinese equities from a diversification angle: currency effect. The Yuan Renminbi is technically strengthening, and the USD/CNY pair has just rejected long-term resistance. As a result, international investors could benefit from a stronger CNY in the coming months.
DISCLAIMER:
This content is intended for individuals who are familiar with financial markets and instruments and is for information purposes only. The presented idea (including market commentary, market data and observations) is not a work product of any research department of Swissquote or its affiliates. This material is intended to highlight market action and does not constitute investment, legal or tax advice. If you are a retail investor or lack experience in trading complex financial products, it is advisable to seek professional advice from licensed advisor before making any financial decisions.
This content is not intended to manipulate the market or encourage any specific financial behavior.
Swissquote makes no representation or warranty as to the quality, completeness, accuracy, comprehensiveness or non-infringement of such content. The views expressed are those of the consultant and are provided for educational purposes only. Any information provided relating to a product or market should not be construed as recommending an investment strategy or transaction. Past performance is not a guarantee of future results.
Swissquote and its employees and representatives shall in no event be held liable for any damages or losses arising directly or indirectly from decisions made on the basis of this content.
The use of any third-party brands or trademarks is for information only and does not imply endorsement by Swissquote, or that the trademark owner has authorised Swissquote to promote its products or services.
Swissquote is the marketing brand for the activities of Swissquote Bank Ltd (Switzerland) regulated by FINMA, Swissquote Capital Markets Limited regulated by CySEC (Cyprus), Swissquote Bank Europe SA (Luxembourg) regulated by the CSSF, Swissquote Ltd (UK) regulated by the FCA, Swissquote Financial Services (Malta) Ltd regulated by the Malta Financial Services Authority, Swissquote MEA Ltd. (UAE) regulated by the Dubai Financial Services Authority, Swissquote Pte Ltd (Singapore) regulated by the Monetary Authority of Singapore, Swissquote Asia Limited (Hong Kong) licensed by the Hong Kong Securities and Futures Commission (SFC) and Swissquote South Africa (Pty) Ltd supervised by the FSCA.
Products and services of Swissquote are only intended for those permitted to receive them under local law.
All investments carry a degree of risk. The risk of loss in trading or holding financial instruments can be substantial. The value of financial instruments, including but not limited to stocks, bonds, cryptocurrencies, and other assets, can fluctuate both upwards and downwards. There is a significant risk of financial loss when buying, selling, holding, staking, or investing in these instruments. SQBE makes no recommendations regarding any specific investment, transaction, or the use of any particular investment strategy.
CFDs are complex instruments and come with a high risk of losing money rapidly due to leverage. The vast majority of retail client accounts suffer capital losses when trading in CFDs. You should consider whether you understand how CFDs work and whether you can afford to take the high risk of losing your money.
Digital Assets are unregulated in most countries and consumer protection rules may not apply. As highly volatile speculative investments, Digital Assets are not suitable for investors without a high-risk tolerance. Make sure you understand each Digital Asset before you trade.
Cryptocurrencies are not considered legal tender in some jurisdictions and are subject to regulatory uncertainties.
The use of Internet-based systems can involve high risks, including, but not limited to, fraud, cyber-attacks, network and communication failures, as well as identity theft and phishing attacks related to crypto-assets.
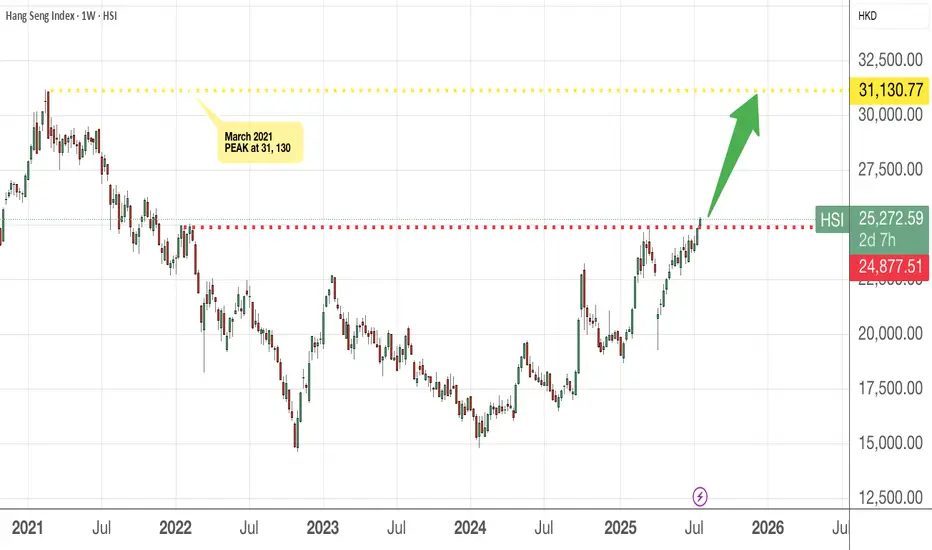
HSI has finally cleared the 25,000 level !!!!Congrats to all who are invested in the HSI index , ETF or individual stocks in HK. You should be smiling as the index crossed the 25k mark.
The next level I am looking at will be 27k mark and this will not be a straight line (as usual). Buy on pullback.
Of course, there are still many who think HK/China markets are not investable, to each his own. Everyone is entitled to your own opinion and you may have a different risk profile, time horizon and way of looking at market.
To those on board, let's ride it higher to the moon, haha!
Dont predict&anticipate the market - ask indicators for hints! Hello everyone! how was the HSI trade so far?
Apologies for not updating as I was allowing myself to take a pause journaling my trade also to pay attention on my own personal growth journey. However, am continue to trade HSI in sustainable and profitable way and have had trying and test using different combination of indicators that bring quite positive results since.
Sharing this with anyone that reading this.
Please note that this is just for my own experiences and please DYODD.
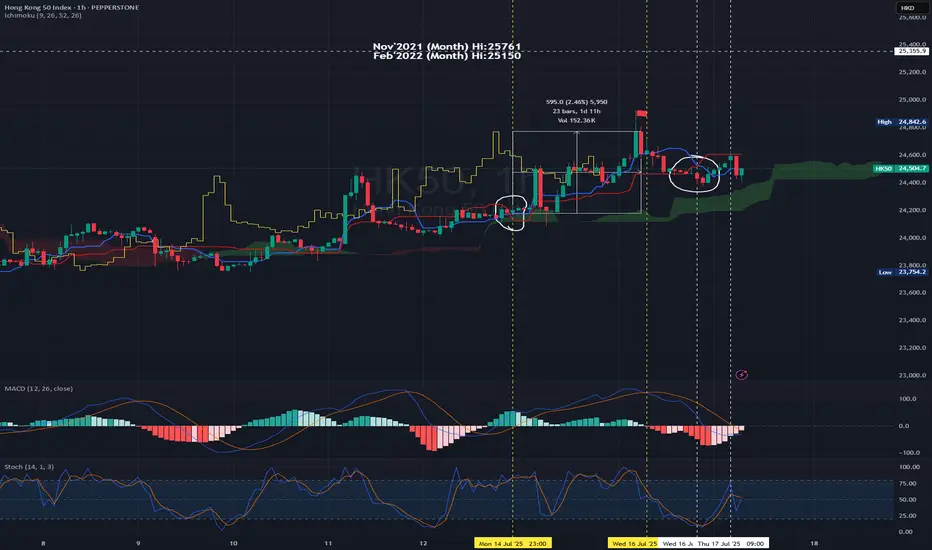
For Swing Trade Test: (some steps to consider for entry set up - setting your time frame)
E.g using 1H Chart - 14Jul2025 23:00
MACD - entering the above zero line - it breaks above zero level on the next candle. Turned bullish confirmation.
Using Ichimoku Cloud for trend confirmation.
Once the MA9>MA26 the blue line crosses above red line (circled in white). This is a bullish confirmation and it is trading above green cloud.
You may pay attention to set your entry point.
Set Up : on the next candle open - you may open Long position - 24204.90 Set SL with R/R Ratio 1:1 or 1:1.1-1.25 (or in accordance to your risk appetite or carry out backtest and to be realistic)
Taking Profit : You may pay attention to be more aggressive to TP only when the MACD is forming DeadCross i.e 16Jul2025 11:00 (using the same timeframe chart).
For the reversed side it's the same methodology. But it's recommended to Short if and only if when the candles are closed below cloud + MACD is on the bearish zone.
So, in this case, I will not open short position as it's not the normal underlying HSI trading hour, so we wait till the underlying normal trading hour commence.
Today HK50 PEPPERSTONE:HK50 open at 24567, you may decide if you would to short and setting SL and TP.
From chart, you may open short position with R/R : 1.1.1 (TP : 24:400; SL : 24772) Entry: 24596 (the next hour candle at 10:00, of course you may cross check with shorter time frame to 'catch the high' 😂)
Trade for profit requires persistency and consistence.
There is quite a wide range to trade in between the movement.
Buy into Support Sell at resistance.
Set your TP/SL & protect your capital.
at point of writing ✍️: the Index uptrend mode is on track.
currently on D Chart -
🗝️ Resistance Level : 24600-24700
🗝️ Support Level : 24370-24400
🗝️ Strong Support Level : 24030-24300
Higher Hi🚩point marked in Chart
21May2025 -23909
11June2025 -24430
25June2025 -24531
16Jul2025 - 24842
?? ??2025 - 25907 Target
Opinion: continue Bullish and shall breaks the recent Hi of 24900 and target could break 25200-25750 pretty soon (the Gravity Line upper band).
The Index is now on the intermediate bullish trend (not far off from Gravity line and not yet touch the Gravity Upper band or beyond for D chart) - Shall publish this indicator.
From previous posts:-
W Chart:- HSI continues its Bullish mode with strong pullback! Recovery could expected to see in end Jun - early Jul'25.
14Jul2025 -
at point of writing ✍️:
Perhaps it shouldn't been said as recovery but continue the uptrend.
As we can notice from the latest chart it seems to continue its uptrend momentum even MACD have had curving down after deadcross formed 12May25.
The MACD signal line staying above zero level.
Continue the Long call for HSI with the forecast and repetitive of history the next 4-6 weeks might be a good profit to hold Long position.
🚨However, please take note that the index is moving beyond the Gravity upper brand on W chart which we should monitor closely to TP and enter again for healthy retracement.
🎯 Reminder: For long term (6-18 months) continue to accumulate China & HKG for the potential upside for the year! All retracement is a good entry point. Again, everything is impermanence. Manage your risk, position sizing. Take only the risk that you can afford.
For HSI HSI:HSI
Recent Hi : 16Jul2025 - 24867.81 (trying to test the resistance at 19March2025@24874)- this ¬6.58pts seems took quite a while to break. Let's be patience.
🔎 DYODD and don't listen to anyone.
Invest in yourself, do some study and learn along the way while you trying to verify or finding the answer if to start invest in CHN/HKG markets.
If you don't know how or where, you may ask Deepseek/Chatgpt for most reputable Trading courses nearest to you.
Let's follow your own zentradingstrategy , continue to trade; a strategy is a raft—cross the river, but do not carry it on your back forever — Stay flexible. No method is permanent. Adapt, let go, grow.
** Please Boost 🚀, FOLLOW ✅, SHARE 🙌 and COMMENT ✍ if you enjoy this idea!
Share your trading journey here to encourage the community and friends who pursing the same journey.
Will China's strong growth and ongoing stimulus lift the HK50?
Despite US-China trade tensions and weak domestic demand, China’s GDP growth has surpassed its 5% target for the first half of the year. According to the National Bureau of Statistics, Q2 GDP grew 5.2% YoY, with authorities noting that stimulus measures aimed at boosting consumption had some effect. Reflecting this momentum, Morgan Stanley raised its 2024 China growth forecast from 4.2% to 4.5%, while Deutsche Bank revised its outlook to 4.7%, a 0.2 percentage point increase.
HK50 maintained its steady uptrend, marking a new 4-month high. Both EMAs widen the gap, indicating the potential continuation of bullish momentum. If HK50 breaches above the recent high at 24600, the index could gain upward momentum toward the next resistance at 24900. Conversely, if HK50 breaks below the support at 24100, the index may retreat to 23730.

(UPDATE) Hong Kong rally is evident to 26,944Hong Kong is shaping up nicely for upside.
We did this analysis in June and now it has broken above the breakout point and is showing signs of a rally.
🧧 1. Mainland Money Flood
Chinese investors are pouring cash into Hong Kong stocks, hitting record levels.
🚀 2. Big IPOs
Huge listings like Shein and CATL are reviving market excitement.
🤖 3. AI & Tech Buzz
Hong Kong’s tech giants are flying thanks to the global AI hype.
And technically it's looking great.
Cup and Handle
Price>20 and 200
Target 26,944
Disclosure: I am part of Trade Nation's Influencer program and receive a monthly fee for using their TradingView charts in my analysis.

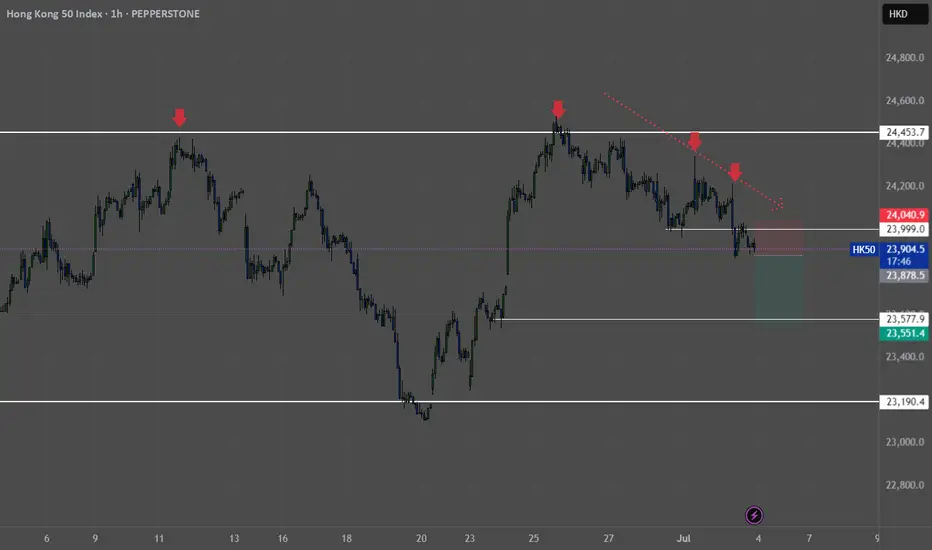
HK50 - H1 - ShortDirection - downwards rejection off 25000 level on the daily, and price moving back into the range.
Level - Price broken support and retested the 24000 level.
Price action - Multiple pin bar rejections off the daily level and hour levels.
UPDATE The future of Hong Kong is here and ready to rally 26,944Have you noticed the developments in China lately?
TOp of the market buildings, technology, self driving train stations, delivery drones and flying cars.
Out of a futuristic movie - but in reality.
It seems like China is breaking away from the dependency to produce for America, and is showing the signs of growth, development and economic independence.
And fundamentally it is looking great too.
🧱 Mainland Money Surge
Mainland Chinese investors have poured a record $90 billion into Hong Kong stocks in H1 2025, boosting liquidity and narrowing the valuation gap with A‑shares
🚀 IPO Wave & Tech Strength
A booming IPO pipeline—including DeepSeek, Shein, CATL—has lifted market sentiment, while tech giants like Tencent, Alibaba, Xiaomi ride the AI growth wave
🤝 Trade Truce Optimism
Reduced U.S.–China trade tensions, including tariff de‑escalation and diplomatic overtures, are powering a broader rebound in risk assets across Hong Kong
🏦 Monetary Tailwinds
Expectations of U.S. rate cuts and continuing PBoC easing are lowering borrowing costs and lifting dividend‑yield plays in banking and property
📈 Market Leadership & Momentum
With a ~20 % YTD gain, the Hang Seng is outperforming mainland China, and analysts expect this victory lap to keep going as global investors re‑orient into Asia
As this is an update the setup remains the same and I guess is just waiting for that boost catalyst to take it up
The Cup and Handle pattern remains with the price needing to break above the brim level and for the price to continue above 20 and 200MA the target is still 26,944.
Disclosure: I am part of Trade Nation's Influencer program and receive a monthly fee for using their TradingView charts in my analysis.

30.06.25 Morning ForecastPairs on Watch -
PEPPERSTONE:HK50
FX:EURJPY
FX:GBPJPY
FX:GBPUSD
A short overview of the instruments I am looking at for today, multi-timeframe analysis down to what I will be looking at for an entry. Enjoy!

The HK50 Robbery: Can You Grab the Cash Before the Cops Arrive?🚨 HK50 "Hong Kong 50" HEIST ALERT: Bullish Loot & Trap Escape Plan! 🚨
🌟 Hi! Hola! Ola! Bonjour! Hallo! Marhaba! 🌟
Dear Money Makers & Market Robbers, 🤑💰💸✈️
Based on 🔥Thief Trading Style🔥 (technical + fundamental analysis), we’re plotting the ultimate heist on the HK50 "Hong Kong" Index Market Cash market! Our master plan focuses on a long entry—targeting the high-risk ATR Zone (overbought, consolidation, potential reversal). Beware: Bears are lurking, and traps are set! 🏆💸 Book profits fast, stay wealthy, and trade safe! 💪🎉
🔓 ENTRY: The Vault Is Open – Swipe the Bullish Loot!
Buy Limit Orders: Place within 15-30min (recent swing low/high).
Alert Recommended! Don’t miss the heist.
🛑 STOP LOSS: Escape Route
Set near the latest swing low or below 4H MA (~23500.00).
Adjust based on risk, lot size, and multiple orders.
🎯 TARGET: 24700.00 (or Run Before It Hits!)
Scalpers: Only long-side plays! Use trailing SL to lock profits.
Swing Traders: Execute the robbery plan patiently.
📡 MARKET INTEL: Why HK50 "Hong Kong" Index Market is a Bullish Target
Fundamental Drivers: Macro trends, COT data, geopolitics, sentiment.
Intermarket & Index-Specific Factors in play.
👉 For full analysis, check the linkss below! 🔗🔗
⚠️ TRADING ALERTS: News & Position Safety
Avoid new trades during high-impact news.
Trailing SL is a MUST to protect profits.
💥 BOOST THE HEIST! Hit Like & Follow!
Support the plan → More profits → Easier robberies! 💰🚀
Stay tuned for the next heist! 🤑🐱👤🤩