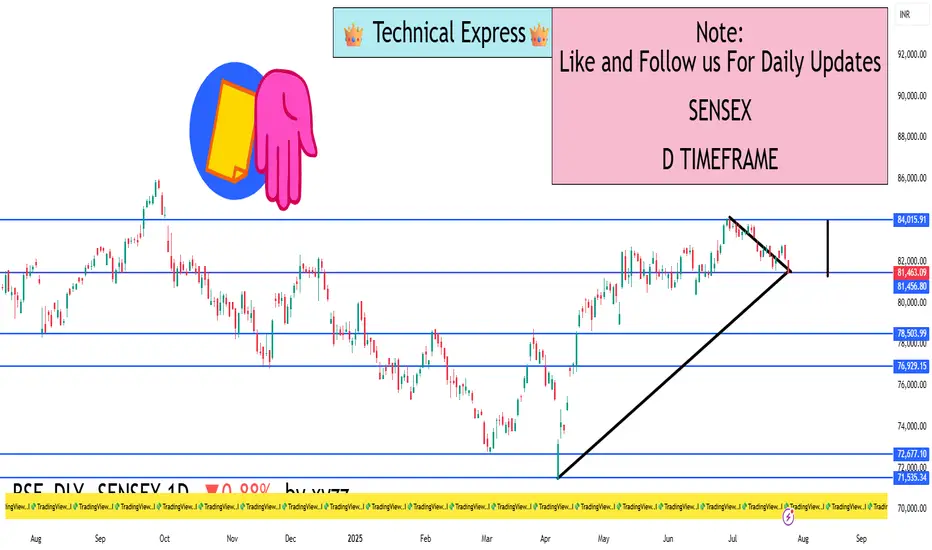
SENSEX 1D Timeframe📉 SENSEX Daily Overview (as of July 25, 2025)
Current Price: Around 81,460
Daily Change: Down by approximately 720 points (–0.9%)
Day’s High: About 82,070
Day’s Low: About 81,400
Previous Close: Around 82,184
📊 1-Day Candlestick Analysis
The candle for today is bearish, indicating strong sellin
Related indices
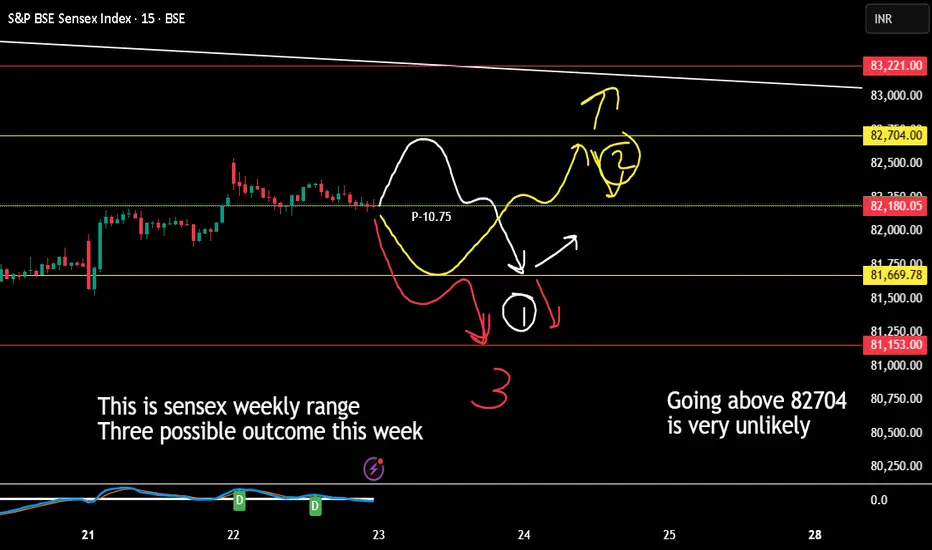
Sensex Weekly Expiry (applicable only till 29th July 2025)1. If Market VIx is less than pivot point then any price coming near pivot line or above is an opportunity to short.
2. Coming to half line below the pivot is highly possible by 80% by 24th July 2025 if not today.
3. That half line point will decide the market direction and any closing below in day
Trap Set at the Top? Sensex Sell-Side Objective = 81,886Sensex is currently trading at 82,220 and showing early signs of a potential sell-side move based on Smart Money dynamics. After grabbing buy-side liquidity above recent highs, we’ve now entered a distribution phase.
Price has shown rejection from a premium zone, and a market structure shift is for

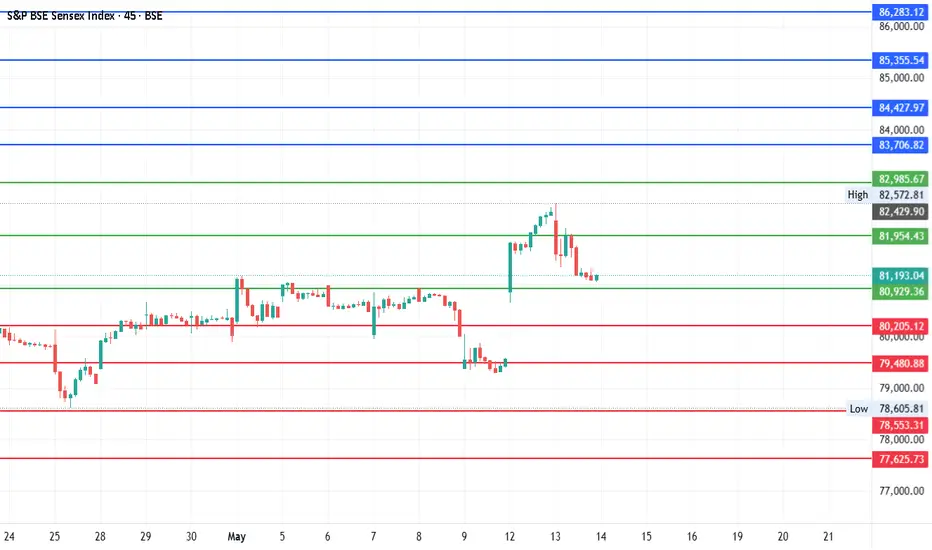
#SENSEX - Another 3500 Points Move?Date: 13-05-25
Current Price: 81148.22
Mid-Point: 81954.425
Upside Targets: 83706.82, 84427.97, 85355.54 and 86283.12
Downside Targets: 80205.12, 79480.89, 78553.31 and 77625.73
Resistance: 82985.67
Support: 80929.3598
#SENSEX
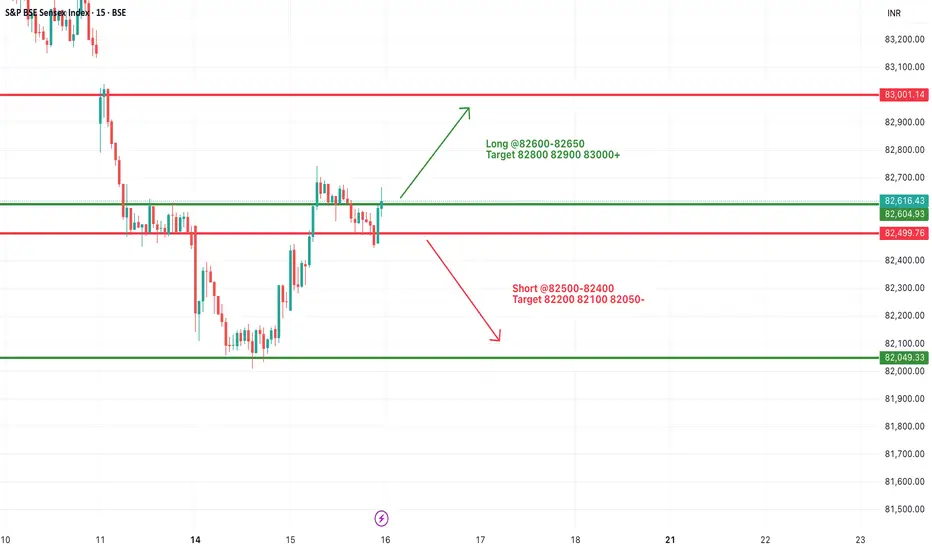
#SENSEX Intraday Support and Resistance Levels - 15/07/2025Sensex is likely to kick off the session with a gap-up opening around the 82500 level, reflecting early bullish momentum. If this initial strength holds and the index begins to build above the 82600–82650 zone, it could signal the start of a recovery leg toward higher resistance levels at 82800, 829

#SENSEX Intraday Support and Resistance Levels - 14/07/2025Sensex is likely to open slightly gap-down, reflecting weakness carried over from the previous session. The index is currently trading near the 82450 zone. A breakdown below the 82400 level may trigger further downside movement, with potential support targets at 82200, 82100, and 82000. This zone sh

#SENSEX Intraday Support and Resistance Levels - 16/07/2025Sensex is expected to open flat near the crucial 82600–82650 resistance zone, which has acted as a turning point multiple times recently. A sustained move above this range may trigger bullish momentum toward 82800, 82900, and even 83000+. This move would indicate a positive continuation after the re
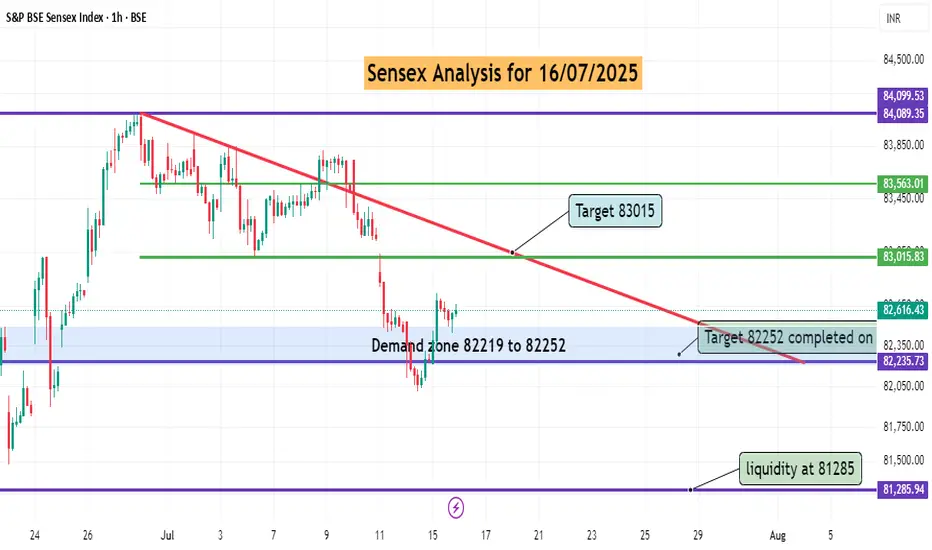
sensex Technical analysis for 16/07/2025sensex got support and sustain on 82200 level today which was demand zone. tomorrow expected to touch 8300 level.
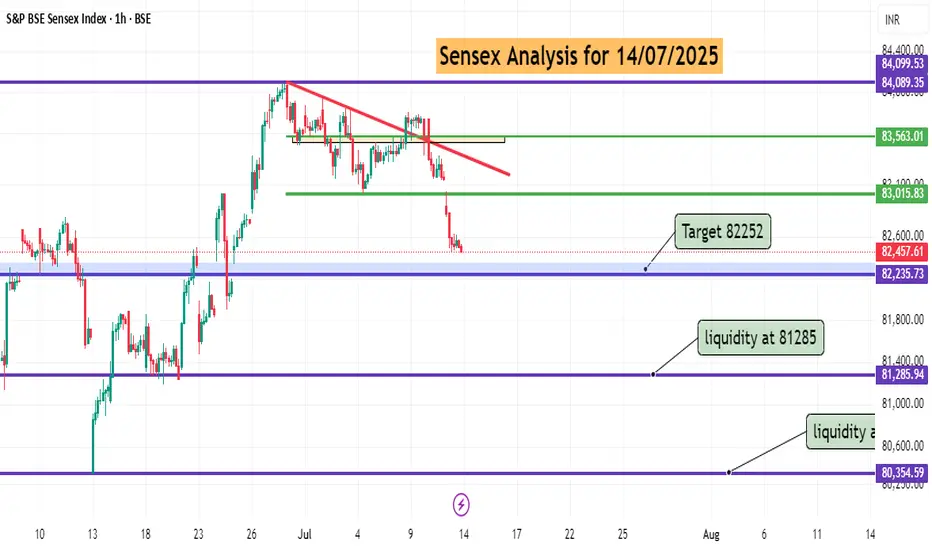
Sensex Technical Analysist for 14/07/2025Strong demand zone is seen near 82219 to 822250 levels. bull may try to enter from here. if market sustain above this level. new buyer will add fresh position at this zone. if bear breaks they will try to grab nest level liquidity at 81285.

Sensex Technical analysis for 14/07/2025Strong demand zone is seen near 82219 to 822250 levels. bull may try to enter from here. if market sustain above this level. new buyer will add fresh position at this zone. if bear breaks they will try to grab nest level liquidity at 81285.
See all ideas
Displays a symbol's price movements over previous years to identify recurring trends.
Frequently Asked Questions
S&P BSE SENSEX is just a number that lets you track performance of the instruments comprising the index, so you can't invest in it directly. But you can buy S&P BSE SENSEX futures or funds or invest in its components.