IOST Token (IOSTUSDT) long.ll description on the chart.
Please, don't forget to like and follow.
Thank you.
Market insights


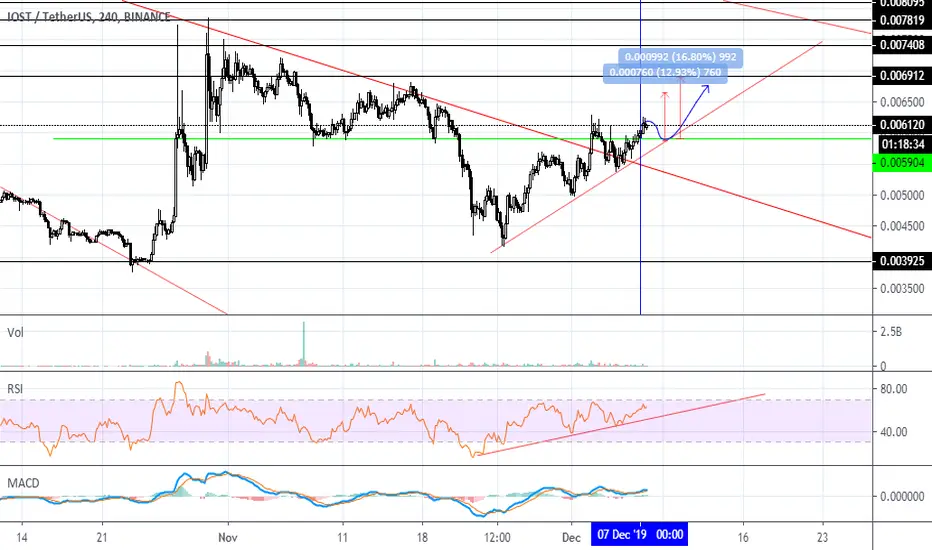
iost/usdtHi guys thanks for checking out my idea as you can see possiable long on iost/usdt.
I typically just let the paint talk for me, as you can see we may have started a accumulation zone.
I also think the levels above have been testesed so if... we can pop threw the tested level we should go to the next.
If we dont make it then safe to say the move is over.
Adjust your stops accordingly and happy trading plz like and follow it really helps me to bring more ideas,thanks again.

iost good accumaltive rangeiost has just broken out of downtrend and retested old resistance and turned support,
looking good here to accumulate imo


another shit is bottomedevery thing is indicated on chart.
NOTE: be flexible in catching your entry,,,it is a demand area


Will the past repeat on iostusdt.Nice setup.
Signal 1: We are in a 3day uptrend (indicator background is green).
Signal 2: daily 200 ma crossover
Signal 3: broke resistant
Signal 4: look at the past, same date one year ago. I Will go for it👍


IOST launches its Decentralized Autonomous Organization Service Maybe this will help:
I will wait for potential trendline retest
IOST launches its Decentralized Autonomous Organization Service “GUILD” project in Europe & co-host a blockchain event in Switzerland on 27th Jan.
PHI team, one of IOST Developer Core Community Member in Japan, is visiting Switzerland to promote the Decentralized Autonomous Organization Service GUILD project and establish a PHI subsidiary in order to enter the Swiss and European markets. PHI’s expansion into Switzerland is supported by the Swiss Global Enterprise‘s Japanese office.
IOST Foundation will support PHI team and shall together visit the local Swiss government, Crypto Valley Association and hold an event at the blockchain incubator facility CVVC in Zug, also famously known as Crypto Valley in Switzerland on January 27, 2020 together with ditCraft project representatives.
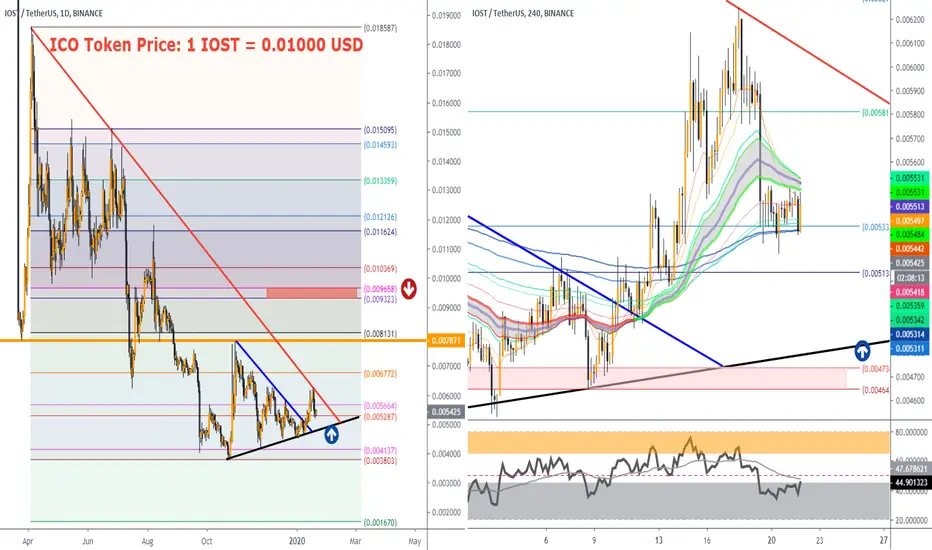
IOST/USDTIost breaking above our 100 MA, immediately resulting in a pump to our 2nd target(vip members). By nature , a daily close above 0.0054$ (100MA) would definitely be bullish or the upcoming weeks. Keep an eye on this coin for the midterm as it has a lot of room to grow; i have indicated some resistance levels that you can use as take profit levels.


IOSTUSDT formed bullish Gartley | Upto 28% move expectedAfter successful formation of bullish BAT pattern now the world's 68th ranked crypto token IOST has formed bullish Gartley pattern and entered in potential reversal zone and ready for bullish reversal soon.
This potential reversal zone should be used as stop loss in case of complete candle stick closes below this zone.
Lets have a look at the dimensions of IOST price action's move:
After initial leg (X to A) the A to B leg is retraced between 0.618 to 0.786 Fibonacci and then B to C leg is projected between 0.382 to 0.886 of A to B leg's Fibonacci projection and final (C to D) leg is retraced between 0.618 to 0.786 Fibonacci as perfectly required for Gartley pattern and now the price action is moving in potential reversal zone of this Gartley pattern, now we can expect bullish divergence at any time which will lead the priceline between 0.382 to 0.786 Fibonacci projection of A to D leg, but after this bullish divergence if the candles sticks will be closed above the 0.786 Fibonacci levels then it can also lead to the long term bullish move.
So as per Fibonacci sequence method we can set our targets as below for mid term trade:
Buy between: $0.004975 to 0.004629
Sell between: $0.005261 $0.005934
As per above targets this trade has potential to give upto 28% gains.
Regards,
Atif Akbar (moon333)
The harmonic moves analysis involves hours of hard work and determination however the success of harmonic trading in fiat and cryptocurrencies is around 80% therefore it is always important that you follow any stop loss strategy while trading harmonic patterns I have also shared a stop loss idea in this article, the information in this article is for educational purpose only this is not an investment advice, I have tried my best to catch the harmonic moves as per predefined classical harmonic Gartley pattern if you find any flaw or you have any suggestion feel free to share with me in comments section.

5 % drop for IOST?IOST reached a resistance level on the 4 hours chart. Moreover, the price has broken a strong resistance on the IOST/BTC chart, which is in correlation with what we see here.

IOST/Tether 60 Binance forms Cup and Handle may see 0.005850With this Cup and Handle PA may move the the next support/resistance line at .005850. PA needs to stay above the angle trend line to stay valid.


IOST - USDTBollinger band is squeezing in 4h, soon iost will reach the 0,007 usdt again in a hours or maybe days
