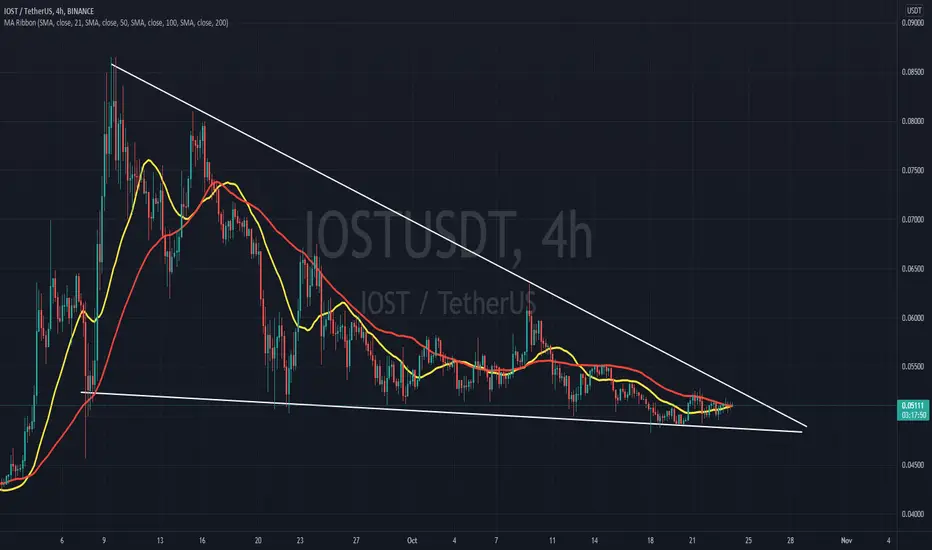
#IOSTUSDT Iost on H2 tf. We are constantly getting higher lows and the resistance level is remaining the same so we are creating a asceding triangle. We should see a nice breakout in the next 12H. RSI confirms what im saying. It keeps bouncing up every time it hits a higher low. My opinion is that the first tp zone should be around .053-.054. After that we might see a slight correction.
Remember that on higher TF, the chart looks like a cup and handle
Market insights

IOST/USDT 4HOUR UPDATEWelcome to this quick IOST/USDT technical analysis .
I have tried my best to bring the best possible outcome me in this chart.
Reason of trade :- IOST/USDT make triangle in 4 hours chart.
Entry:- cmp or upside the 21 ma
Target:- 0.4900
Stop loss:- $0.027438
Remember:-This is not a piece of financial advice. All investment made by me is under my own risk and I am held responsible for my own profit and losses. So, do your own research before investing in this trade.
Happy trading.
Sorry for my English it is not my native languages.
Do hit the like button if you like it and share your charts in the comments section.
Thank you...
IOST MOONSHOT 💥The chart is showing a falling wedge, which is a bullish pattern.We will see a a breakout in upcoming days.
Showing a bullish momentum
The price is above SMA which is bullish
MACD is showing a possible bullish momentum
RSI is neutral ; More rooms to grow
currently sittingon 0.5FIB
If it manage to break the resistant trendline ,We will see the marked target soon.
0.13$ (1.618 FIB) is the realistic target.
Happy trading 💥

IOSTUSDT - Ticker request IOST needs to break the major resistance ( horizontal) to see some upside continuation.
If we fail we can move down to the green box.
On the larger timeframes we are just searching a weekly higher low.
Thanks for taking your time to check out my idea 😎😎! Often, my ideas are fast gone from the front page because there are so many ideas on the platform and the algo picks the one with more likes 🤖🤖. I think once I have around 20 likes/idea my idea will be shown in front 🥳🥳. It would be awesome if you could like my idea, (only if you really like it of course) 🤪! I believe that the more we can interact with each other, and share thought about an idea, the more we can learn! 👩🏫🧑🏾🏫👨🏻🏫
Furthermore, I made a challenge for myself, I will add 1 idea for every new follower🦹♀️ So if I have 1 follower each day, I will add 1 idea. If I have 10 followers, I will add 10 🏌️♂️ It’s fun for me and you! More followers = more ideas = powerful community! 💪💪💪 Besides, all the ideas are … FREE 🥳🥳🥳
⚠️⚠️ If you want to know how my previous ideas played out, > push the play button on my previous ideas and check it out 🕵️🕵️
Is there a ticker you want me to look into? Let me know in the comments below ⬇️⬇️⬇️
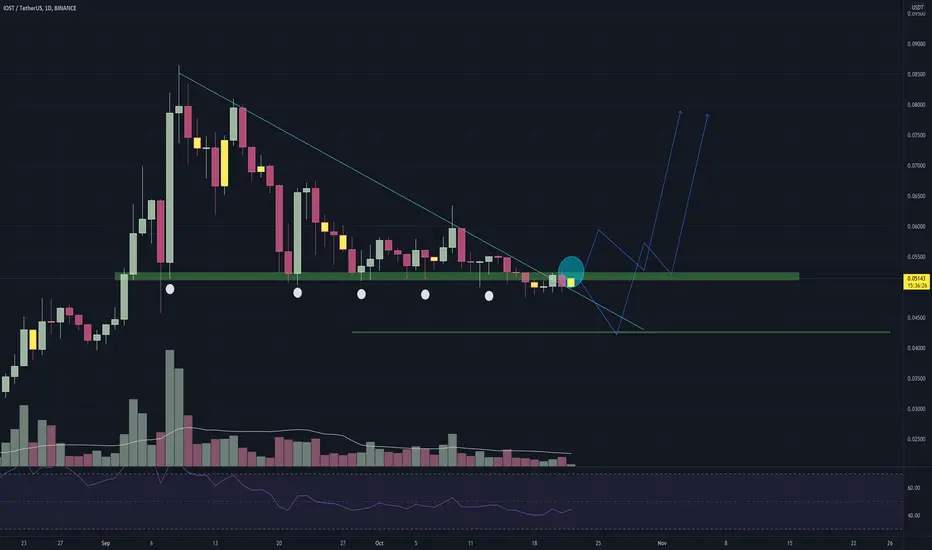
IOST 1D Cup and HandleLooking nice sitting under the 0.5 fib level. If it breaks above this and retests, good entry point.
Measured move is around the 1.618 fib level from the cup and handle, if not a bit shorter.

Iost Chart Analysis #iOST USDT 1D Chart SIGNAL by Sajjat Hossen
Risky Call ⚠️
Entry ✅ If 1D Candle Close Above $0.0514
Stop-loss ❌ If 1D Candle Close Below The $0.0484
1D Chart...

IOST/USDT TRADE SETUP!Hello everyone, if you like the idea, do not forget to support with a like and follow.
Welcome to this IOST trade setup. IOST looks promising in 4hr timeframe and is currently at the support. It is hovering inside a big ascending triangle. When it breaks the triangle it pumps hard. I'm expecting a 30-40% pump from here.
Entry range:- $0.050-$0.052
Target1:- $0.05664
Target2:- $0.06266
Target3:- $0.06626
Target4:- $0.07244
SL:- $0.04782
Buy on spot or you can buy it with low leverage 3x-5x.
If you like this idea then do appreciate it with like and follow.
Also, share your views in the comment section.
This isn't financial advice. DYOR before investing.
Thank You!


IOSTUSDTBINANCE:IOSTUSDT Analysis ABC.
( A ) Starting point movement .
( B ) Entry point.
( C ) Target
Target 1: 0.08255
Target 2: 0.10335
Target 3: 0.13007
Target 4: 0.15524

iostusdtiost is making a cup and handle on longer time frame .It can be good buy here .most handles are made at 0.5 fib level of cup lenth and price is now at 0.5 .sometimes it makes a wick towards 0.618 which is covered in the demand zone . I expect a well run by iost in coming months. this one candle is of 3 days .long term trade .
NFA DYOR

IOSTUSDT - BULLISH CONTINUATIONIOST correction looks to be coming to an end, price has clearly found support at the 0.618 fib showing multiple rejections to the downside the range is narrowing showing signs of a breakout to come. I am waiting for either the market to make a fake break below support to hunt the stops and gather liquidity or a break above the descending corrective trendline for a entry confirmation to long.

IOSTUSDT BUY SETUPHi everyone :)
I’m meck and this is my first post in tradingview. The start for exciting and profitable journey.
A buy setup for IOST/USDT
With a nice risk to reward ratio. Golden lines are targets and 0.03549 is stop loss.
let me explain why we should buy this coin:
After breaking out a daily resistance zone ( near 0.0395$ ), A Flag Limit appeared from August 23 to September 3. On September 7, we can see FTB (First Time Back) and first time retesting of this daily demand zone. But engulfing didn’t happen. So we can count on this buying zone for the second time and set our buying orders inside of the Flag Limit zone.


iostusdtHello everyone 😃
Before we start to discuss, I would be glad if your share your opinion on this post and hit the like button if you enjoyed it !
4 hr analysis

Iost/usdt 1dYou can get some idea. When you see the chart. When down trend line break it can be up to previous high. But carefully watch the support lines.

IOSTUSDTIOSTUSDT needs to get the price0.056 back to grow. Otherwise, upward movements is not possible

IOST 65% Possible jumpIOST at bottom of Triangle Pattern that has held the bottom above $0.05000 since 09/07/21. Exaggerated Divergence on 8 hour chart on MACD, RSI, and Histogram. Also in smaller falling wedge pattern on smaller time frame with brake out bringing price action out of triangle pattern to $0.06100. Probably see some resistance around there. Then possibly up to $0.085 plus.


IOST/USDTIf handle is completed and IOST is above resistance(there might be a retest), price might be up 5x in 4 to 5 months(April 2022)


1H IOST EMA50 CatchHello,
In this trade I am only using 1 EMA indicator, and only long when price is above EMA50, and short when price is below EMA50
IOST seemingly broken the daily trendline is now retesting in the lower timeframe. A possible continuation to the upside.
Looking at target profits at 0.070
What are your thoughts?

IOSTUSDT Descending TriangleWatch out for which line it Breakout either top for reversal or bottom line to continue downtrend.
#TAYOR HUOBI:IOSTUSDT
