TradeCityPro | IOTA: Testing Key Resistance in RWA-DePIN Rally👋 Welcome to TradeCity Pro!
In this analysis, I’m going to review the IOTA coin for you. This project is one of the RWA and DePIN-based initiatives and is among the older projects in this category.
✔️ The coin has a market cap of $822 million and ranks 85th on CoinMarketCap.
📅 Daily Timeframe
As you can see on the daily timeframe, after finding support at 0.1547, the price initiated a bullish leg and moved up to the resistance zone I’ve marked.
💥 This area is a very significant resistance zone, and in this bullish leg, the price has reached it for the first time and got rejected.
🔍 In my view, as long as the price hasn’t confirmed a breakout above 0.1960, the chance of starting a downtrend is higher than continuing the current uptrend. If this resistance zone is broken, we can consider it strong confirmation of buyer strength.
📈 For a long position, we can enter on the breakout of this same zone. For spot buying, this trigger can also be used, but the main long-term triggers are 0.3774 and 0.4918.
⚡️ On the RSI oscillator, there's an important zone at the 50 level. If this level is broken, the probability of breaking 0.1960 increases. If that happens, the next support zone will be 0.1547.
📊 Make sure to pay close attention to volume. If any of our triggers are activated without volume confirmation, the likelihood of a fake breakout increases.
❌ Disclaimer ❌
Trading futures is highly risky and dangerous. If you're not an expert, these triggers may not be suitable for you. You should first learn risk and capital management. You can also use the educational content from this channel.
Finally, these triggers reflect my personal opinions on price action, and the market may move completely against this analysis. So, do your own research before opening any position.
IOTAUSDT trade ideas

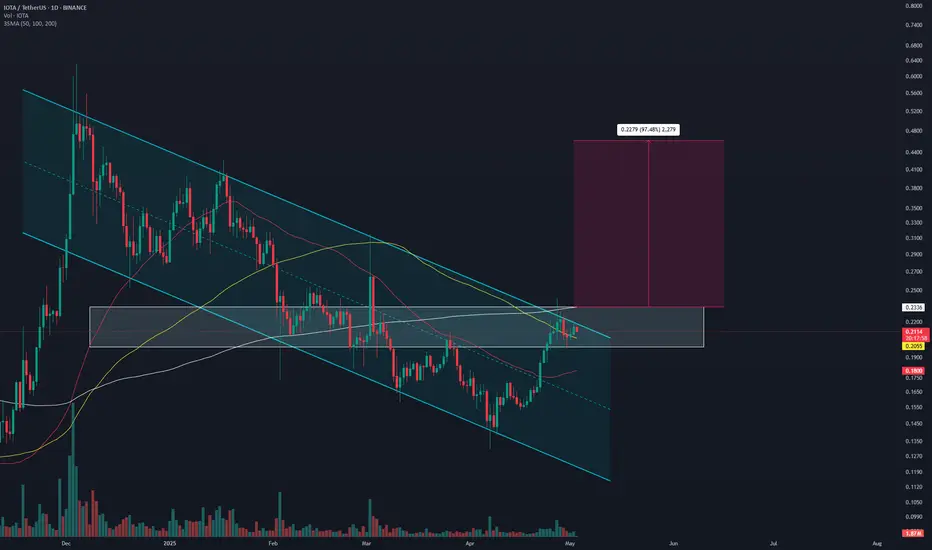
SYSTEM SIGNAL: IOTA SHORT12/05/2025 IOTA Short
It's time to correct! Even though the bias and momentum are strongly to the upside, I believe there's a good chance for this short! Fireee! 🔥
ENTRY: 0.2491
STOP: 0.7922
TP1 -> RR1.5: 0.2216 -> 67% probability
TP2 -> RR2: 0.2124 -> 33% probability
TP3 -> RR3: 0.1940-> 17% probability
BIAS: Long-> half size

IOTA Breakout alert Successfully breakout this resistant line with a short -term target of at least +10%

SYSTEM SIGNAL: IOTA LONG08/05/2025 IOTA Long
As mentioned in the previous IOTA post, I was expecting a reversal — and here it is!
For this long setup, I'm entering in two parts: the first with half size at the breakout, and the second half if the price reaches the purple highlighted area.
ENTRY: 0.2205
STOP: 0.2077
TP1 -> RR1.5: 0.2396-> 71% probability
TP2 -> RR2: 0.2461 -> 57% probability
TP3 -> RR3: 0.2588 -> 57% probability
BIAS: Short -> half size

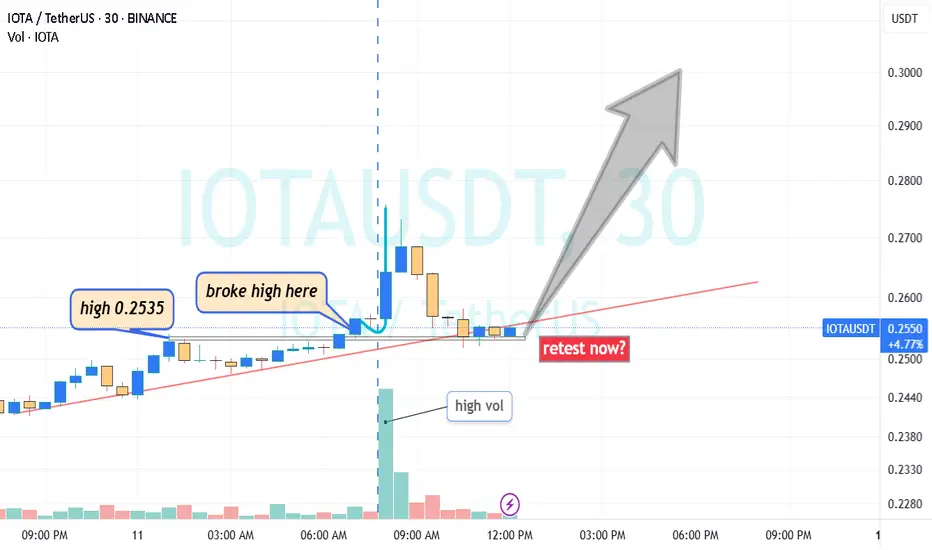
IOTA? retest
HI
You can do 10million ideas with theories(avail from TT / Youtube)
Execution and money management is #1
All the best
Not a guru
IOTAUSDT UPDATE
IOTA Technical Setup
Pattern: Falling Wedge Breakout
Current Price: $0.2097
Target Price: $0.38
Target % Gain: 90.97%
Technical Analysis: IOTA has broken out of a falling wedge on the 1D chart, confirming bullish momentum with a strong price surge and volume spike. A retest of the breakout zone appears to be holding well.
Time Frame: 1D
Risk Management Tip: Always use proper risk management.

IOTAUSDT Analysis D1IOTAUSDT Seems Like Ready For Strong Bullish Rally, Breakout And Retest Has Already Confirmed, Expecting 2x In Coming Days .
IOTAUSDT 1D AnalysisIOTA ~ 1D Analysis
#IOTA Buy after successfully penetrating this resistant line with a short -term target of at least 10%+ from here.
#IOTA/USDT#IOTA
The price is moving within a descending channel on the 1-hour frame, adhering well to it, and is on its way to breaking it strongly upwards and retesting it.
We are seeing a bounce from the lower boundary of the descending channel, which is support at 0.2125.
We have a downtrend on the RSI indicator that is about to break and retest, supporting the upward trend.
We are looking for stability above the 100 moving average.
Entry price: 0.2135
First target: 0.2261
Second target: 0.2364
Third target: 0.2483

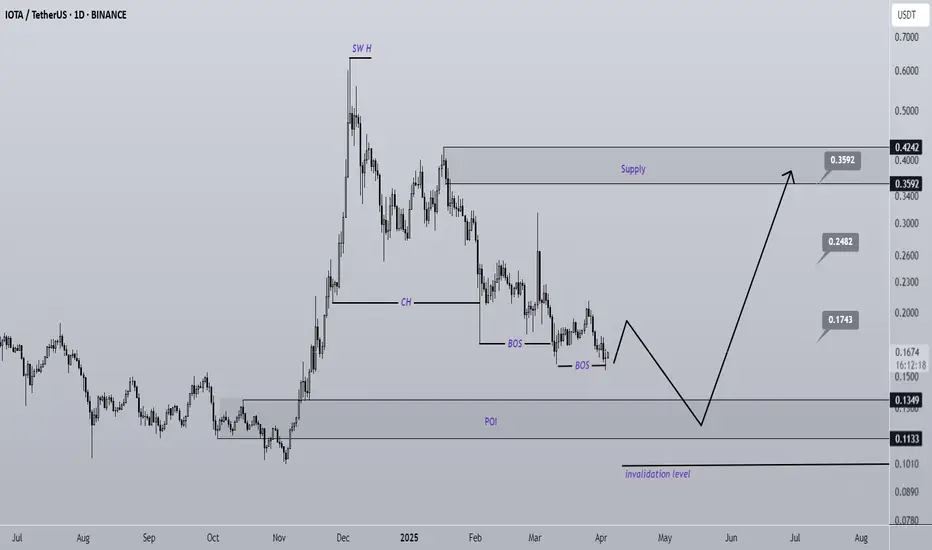
IOTA Analysis (1D)IOTA has a bullish structure on the higher timeframes. It is currently approaching a support zone through a time-based correction.
We are looking for buy/long positions around the POI (Point of Interest) zone.
Targets are marked on the chart.
A daily candle closing below the invalidation level will invalidate this analysis.
Do not enter the position without capital management and stop setting
Comment if you have any questions
thank you
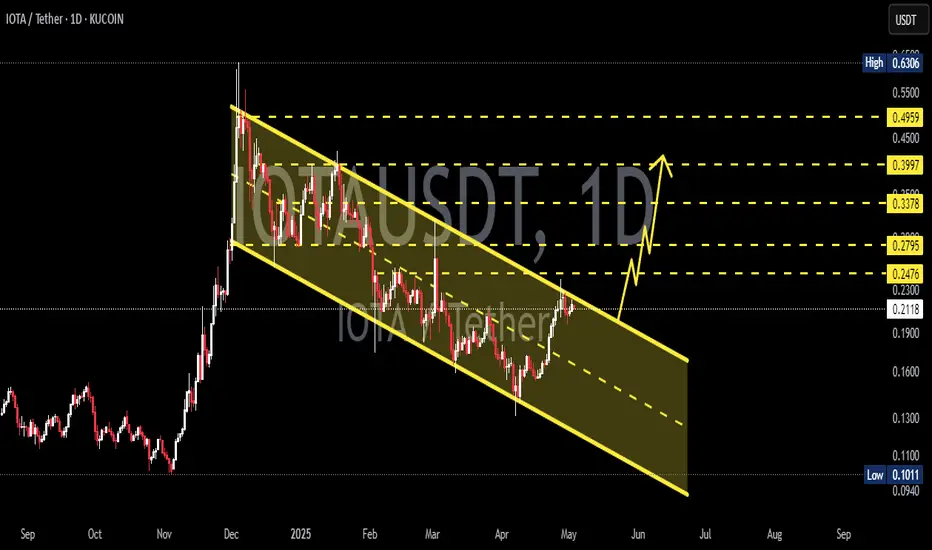
IOTA: Your Altcoin Choice (S3.5)IOTAUSDT was producing lower lows until November 2024, then it went bullish and the correction of this bullish wave ended as a strong higher low. This is the 7-April low three weeks ago. Now IOTAUSDT is full green on the third week. Growing non-stop since the bottom was hit.
So the charts are great. We can see the bear market, a consolidation period and then a recovery phase. Now comes the next stage of the cycle and this is a new bull market. See the action in 2021 for reference. Massive growth ahead.
Some targets can be seen on the chart. These are not potential ATH projections but rather conservative targets. Total growth in 2025 can be much more and it seems possible that the bull market will extend into 2026 because time is needed for massive growth.
The next cycle top can happen in November 2025 just as it can happen in February or March 2026, too early to know.
If we take November 2024 as the market bottom and count 1 year and 1 month for the totality of the bullish phase, this would put a new cycle top around December 2025, give or take a few days.
That's just the map. This can give you an idea of what to expect.
Plan and ahead and prepare.
I am wishing you great profits, ease in your personal growth journey and financial success.
May your life be blessed with abundance.
Thanks a lot for your continued support.
Namaste.

IOTAUSDT 1D#IOTA has broken above the falling wedge resistance and now is breaking out above the MA50 on the daily chart. Looks promising. Targets are:
🎯 $0.2095
🎯 $0.2492
🎯 $0.2891
🎯 $0.3225
🎯 $0.3818
⚠️ Use a tight stop-loss.

IOTA USDTIOTA has been in a downtrend since early December 2024. However, the price is now showing signs of a potential trend reversal. A clean break above the $0.1737 level and the descending trendline would be a strong first step. Price has held firm support in the $0.1307 – $0.1421 blue zone.

IOTAUSDT 1WIOTA ~ 1W Analysis
#IOTA Buy gradually from here if you still have a Conviction on this coin with a short -term target of at least 20%+.

IOTAUSDT?
Hi,
Momentum comes from volume.
Last few days volume spiked & moved 15%.
Hope to see a continuation with higher volume & participation..
If no momentum.. just be ready to cut below.. or at range..
1:1 only.
You'll never control or dictate price.. becoz you are not market maker/ or a whale.
I'm a follower
Not a guru.. that's why I have SL
All the best guys, wishing you a profitable year.. and beyond.

IOTAUSDT BIG move incoming Position Accordingly
IOTAUSDT 1D
Thiis going to Hold here and give a massive Pump sooner.
Next leg Up is going to be faster and greater.
I am already in a Spot long and will look for Longing this with leverage.
Note: Not a Financial Advise.

IOTA Spot SwingOne of the Best Buy ATM.
If holds here for a bit this can pull a massive pump to price above 1 which makes 500+% on Spot if correct on Idea.
I Bought DCA in the current zone.
0.1600-0.1800
Tight Invalidation Clean breaking below 0.1600


IOTAUSDT 1WIOTA ~ 1W Analysis
#IOTA Buy gradually from here if you still have a Conviction on this Coin.
With a short -term target of at least 20%+.

SPOT IOTA LONG 19.02.2025Pinning after exhaustion of sales.
💰I enter at the market price.
🔏The trade be closed manually or with a limit order by:
0.2879
I'll let you know when I record it manually.
‼️Risk per trade: 1% of the allocated funds for spot trading.
Thank you!

SPOT IOTA LONG 8.01.2025Pinning after containment of sales.
🎯Purpose:
0.2381
I'll let you know when I record it manually.
‼️Risk per trade: 1% of the allocated funds for spot trading.

Can #IOTA Gain Bullish Momentum Again or Not? Key Levels Yello, Paradisers! Is #IOTA about to break out or is another rejection going to send it even lower? Let’s break down the latest #IOTAUSDT setup:
💎#IOTA is forming a bullish flag on the 1D timeframe, a classic continuation pattern that often leads to a strong upward move. After a parabolic run in late 2023, price action has been consolidating within a descending channel, respecting both support and resistance levels. But the real battle is about to begin.
💎The key breakout zone sits around $0.31—this is the descending resistance that IOTA must break to confirm a bullish reversal. A clean breakout with volume could send prices surging toward the $0.61–$0.63 resistance zone, where sellers may step in.
💎On the downside, the support zones between $0.17 and $0.10 remain crucial. Bulls need to defend this area to maintain the bullish structure. The buyers have already tested these levels, and they held. You can watch for strong volume and the 50-EMA to confirm growing demand at these levels.
💎If buyers fail and a daily candle closes below $0.10, it would invalidate the bullish scenario, potentially leading to a deeper correction toward lower levels.
Stay focused, patient, and disciplined, Paradisers🥂
MyCryptoParadise
iFeel the success🌴

