Trade ideas

IOTA price is ready for further growth?Another “old man” #IOTA woke up, whose price was in a downward trend: 2021, 2022, 2023 and almost all of 2024)
Today, OKX:IOTAUSDT finally managed to break through the strong mirror level of $0.45
1️⃣ Further, to continue the growth, buyers need to keep the price above $0.45
2️⃣ If this is done, there is a good chance of continued growth. But starting from $0.68 and up to $1.88, there will be a lot of people willing to sell this asset, which has been in the holding for more than two years. This, in turn, may affect the growth dynamics.
3️⃣ If the #IOTAUSD
price cannot be kept above $0.45, it is advisable to keep in mind that a possible correction to $0.20 is possible.
_____________________
Did you like our analysis? Leave a comment, like, and follow to get more

IOTA Soars 56% as Rebased Upgrade Voting BeginsIOTA ( FWB:IOTA ) has experienced a remarkable surge, climbing over 56% to $0.5780. This leap follows the initiation of voting on its groundbreaking Rebased upgrade, positioning IOTA as one of the top performers among the 100 largest cryptocurrencies by market cap. Let's explore the driving forces behind this rally from both fundamental and technical perspectives.
Fundamental Drivers: The Rebased Upgrade
The primary catalyst behind IOTA's surge is the launch of voting for the Rebased upgrade. This upgrade represents a transformative shift for the IOTA L1 mainnet, introducing features aimed at enhancing decentralization, scalability, and utility:
- Staking Rewards: Users can now earn IOTA staking rewards, with an initial target inflation rate of 6% to 7%.
- Move-based Smart Contracts: Support for deploying smart contracts based on the Move programming language expands IOTA’s capabilities.
- Reduced Transaction Costs: Adaptive fee-burning and sponsored transactions aim to lower costs, fostering broader adoption.
- Full Decentralization: The upgrade aims to fully decentralize the IOTA ledger, enhancing trust and transparency.
Voting will continue until December 9, with the counting process concluding on December 16. The upgrade has heightened investor optimism, evident in IOTA's soaring futures open interest, which reached a record $87.89 million—more than tripling from last week’s $26.27 million.
Technical Analysis:
Technically, IOTA is exhibiting strong bullish momentum:
- Price Action: The altcoin has surged 55% in 24 hours, hitting a six-month high of $0.5780. Its monthly gains now exceed 350%, with daily trading volume spiking by 83% to over $705 million.
The Relative Strength Index (RSI) stands at 89, indicating overbought conditions. Despite this, there are no immediate signs of a cool-off, suggesting sustained buyer interest.
After a prolonged six-month consolidation phase, IOTA's breakout signals a potential continuation of the uptrend. The consistent series of green candlesticks confirms strong buying pressure.
Broader Market Context
IOTA's rally aligns with broader altcoin market momentum. The Altcoin Season Index at 81 indicates that altcoins are outperforming Bitcoin, reflecting growing investor appetite for high-potential projects. Additionally, the Crypto Fear and Greed Index at 76 underscores prevailing bullish sentiment.
Conclusion
IOTA's surge is underpinned by significant fundamental advancements and robust technical indicators. The Rebased upgrade promises to transform IOTA into a more decentralized and utility-rich network, while technical patterns suggest further upside potential. As the voting process unfolds, IOTA remains a standout asset in the altcoin market, capturing the attention of both retail and institutional investors.

IOTA chart update. The $IOTA/USDT pair has officially smashed through a long-standing descending wedge pattern! After months of consolidation the price has surged by an impressive 83.79% in just one week!
Key Highlights:
Multi-Year Pattern Breakout: A descending wedge typically signals a bullish reversal, and this breakout confirms it
Massive Momentum is on the bulls' side as resistance levels crumble.
Next Target Levels: Are we headed to $0.80 or beyond? Let’s discuss.
What does this mean for the future of FWB:IOTA ? Could this be the beginning of a new macro uptrend? Share your thoughts below.
#Crypto #IOTA #Trading #CryptoNews #Altcoins #Breakout #TechnicalAnalysis #CryptocurrencyInvesting

Here I buy IOTA at $0.45 centsBuying IOTA at $0.45 cents right now
And IOTA supply shock is getting triggered too
MONEY BABY, MONEY. MONEY. MONEY.
All I ever wanted
All I ever needed
Is here in my aaaaaarms
Words and are very unnecessary
They can only do harm

This will send this coin to 1.20Was fallowing XRP in same chanel, after braking uppside it went another 300 procent. This with such a low market cap and circulation this bull market will pas 10 dollars. Double in next few days. Thank You for keep donating in to MEMEFLATE, each dollar will go to charity.

#IOTA/USDT#IOTA
The price is moving within a descending channel pattern on the 12-hour frame, which is a retracement pattern
We have a bounce from a green support area at 0.2000
We have a tendency to stabilize above the Moving Average 100
We have an upward trend on the RSI indicator that supports the rise and gives greater momentum
Entry price is 0.2100
The first target is 0.2471
The second target is 0.2700
The third goal is 0.2990

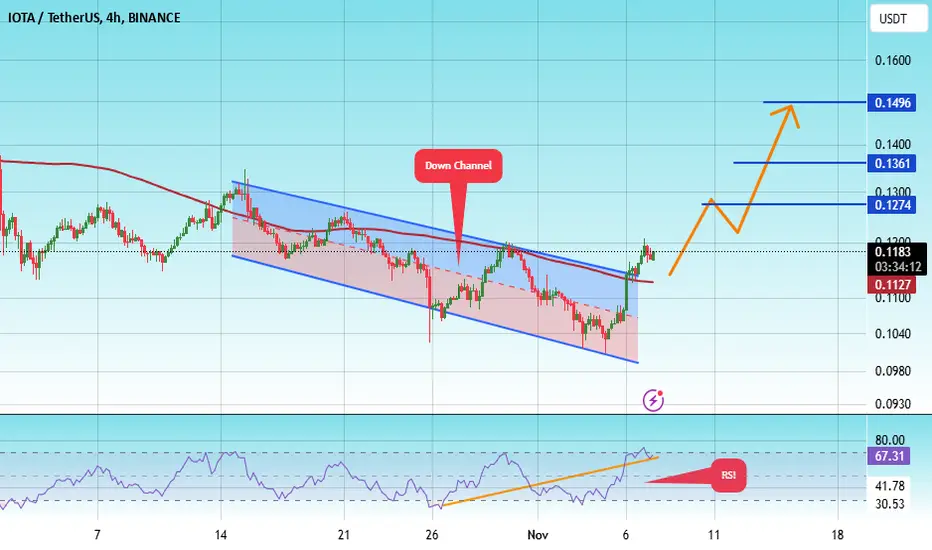
#IOTA/USDT /Ready to go up#IOTA
The price is moving in a descending channel on the 4-hour frame and sticking to it well
We have a bounce from the lower limit of the descending channel, this support is at 0.1011
We have an upward trend, the RSI indicator is about to break, which supports the rise
We have a trend to stabilize above the moving average 100
Entry price 0.1182
First target 0.1274
Second target 0.1360
Third target 0.1496
IOTA superbIota looking super bullish after our Fbuy print. A good volume is already generated.
Expecting next stop at 0.42 area.
DYOR
For indicator access drop a message.

SPOT IOTA LONG 30.11.2024🎯Purpose:
0.3401
‼️We enter at 0.5% of the allocated money for spot trading.

IOTAUSDT Long Setup Setting / Am I going to let you lose?BINANCE:IOTAUSDT
CRYPTO:IOTAUSD
📈Which side you pick?
Bull or Bear
SL1 ---> Low-risk status: 3x-4x Leverage
SL2 ---> Mid-risk status: 5x-8x Leverage
(If there is just one SL on the chart, I suggest, low risk status)
👾Note: The setup is active but expect the uncertain phase as well. also movement lines drawn to predict future price reactions are relative and approximate.
➡️Entry Area:
Yellow zone
⚡️TP:
0.2189 (Close it if you don't want to lose any)
0.2282
🔴SL:
0.2030
🧐The Alternate scenario:
If the price stabilizes against the direction of the position, below or above the trigger zone, the setup will be canceled.

IOTAUSDT Elliott Waves (Local Setup)Hello friends.
Please support my work by clicking the LIKE button👍(If you liked). Also i will appreciate for ur activity.
Everything on the chart.
Entry zone: market and lower
Targets: 0.15 and 0.18
after first target reached move ur stop to breakeven
Stop: 0.0046 (depending of ur risk).
ALWAYS follow ur RM
risk is justified
It's not financial advice.
DYOR!

IOTA Upside ReversalPrice broke the descending trendline with an impulsive wave. Everything is favorable for a continued upside.
Ideally, I'd like to see a test of the 50-61.8% pullback zone, testing the gray trendline as support.

IOTAUSDTIOTA ~ 1W
#IOTA this is the lowest support block on this coin. Buy in stages with a minimum target of 20%++. Don't miss this lowest price.

IOTAUSDTFWB:IOTA ~ 1W
#IOTA If you have Conviction on this coin,. This support block would be a very good buy for now.

IOTAUSDT.P shortAs of the moment, the direction of this market is sideways. Waiting for the token to touch the zone before making some decisions. However, this is my initial plan for this trade. Got my resistance and support for my TP area. will look for a confirmation candle before marking my SL.

IOTAUSDTIOTA ~ 1W
#IOTA If you have Conviction on this coin,. This support block would be a very good buy for now.

IOTAUSDTIOTA ~ 1W
#IOTA If you have Conviction on this coin,. This support block would be a very good buy for now.

IOTA is bullishFrom where we put the red arrow on the chart, it seems that the correction of IOTA has started.
This correction seems to be a double (zigzag + triangle) that is now over and the trigger line is broken.
By maintaining the green range, it can move towards the targets.
Closing a daily candle below the invalidation level will violate the analysis
For risk management, please don't forget stop loss and capital management
When we reach the first target, save some profit and then change the stop to entry
Comment if you have any questions
Thank You

Good time to buy IOTAIOTA (IOTA) is one of the first coins which I started to follow and invest in. This is trade (investment) setup on larger timeframe. I am not looking to reach targets 2,3,4 and 5 very soon, that could be year(s). I will sell most of my capital on targets 3 and 4. Small portion will be sold on Target 1 and 2.
Entry Zone: 0.2599 – 0.3174
Buy Zone 1: 0.1057 – 0.1624
Target 1: 0.8783 – 0.9707 (177%)
Target 2: 1.3817 – 1.4556 (335%)
Target 3: 1.77 – 1.81 (468%)
Target 4: 2.29 – 2.39 (631%)

$IOTA Long ContinuesIOTA reacts nicely to 4 hour hold levels.
If you are in a long TP 1 should be 0,1397.
Given that markets start to feel fresher i'd let 50% run to catch further upsied

$IOTA/USDTP 4h Buy opportuniuty on Holdlevel supportFWB:IOTA hitting into a restance Zone here. We have a newly formed 4h support hold level.
Expecting a retract and an opportunity to long again at the 0.1313 area for a further continuation to the upside

$IOTA/USDTP 4h longNice chance if we reclaim the upward trend and close above 0.1307.
Long setup towards the next holdlevel at 0.1344-0.1351.
Recomend to close 75% in this range as it likley not gonna break that resistance at the first attempt
