
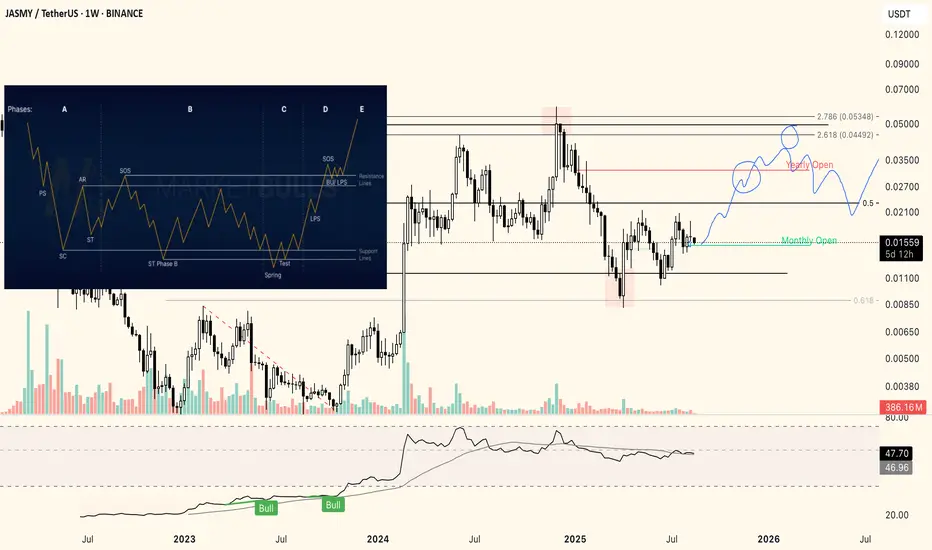
JASMY possibly finishing an accumulation scheme hereAs said in the title, current PA looks like we are now finishing the Spring & Spring-test phase of a wyckoff accumulation cycle. Blue squiggly line is type of PA I expect, not an exact representation. DYOR.
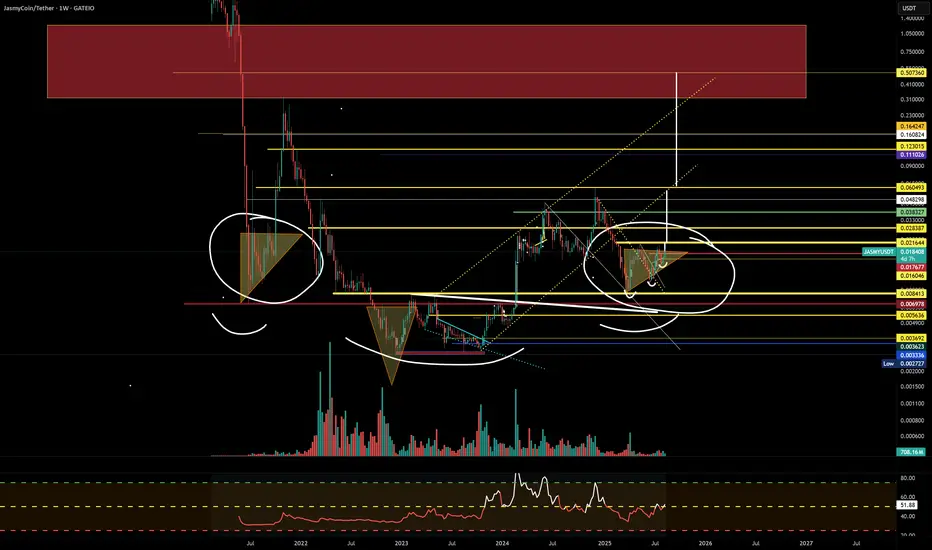
INVERSE HS MACROBeen following JASMY for a couple years now...took it from the lows and sold waiting for the macro right shoulder to form. No coincidence that it is putting in the same macro weekly ascending triangle on the right shoulder that it did on the left shoulder from 2021. It held the other day while the
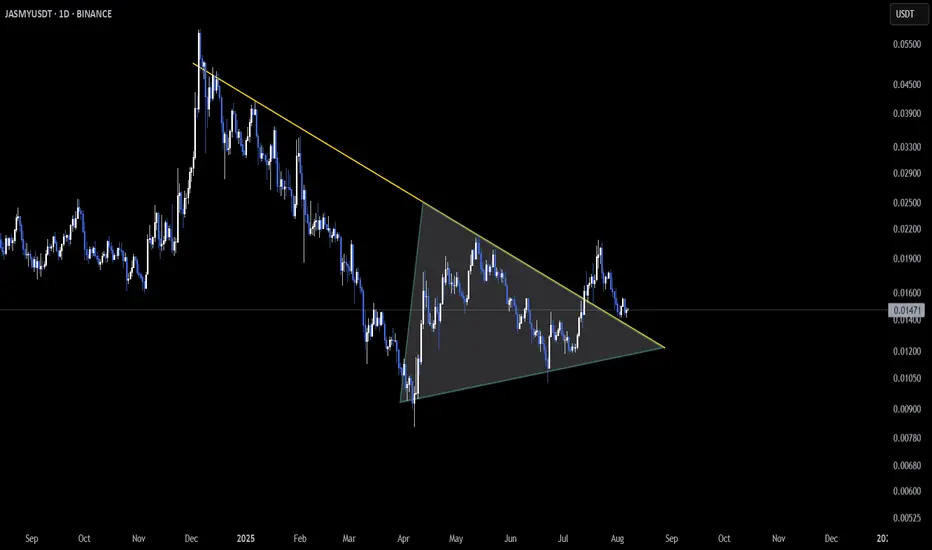
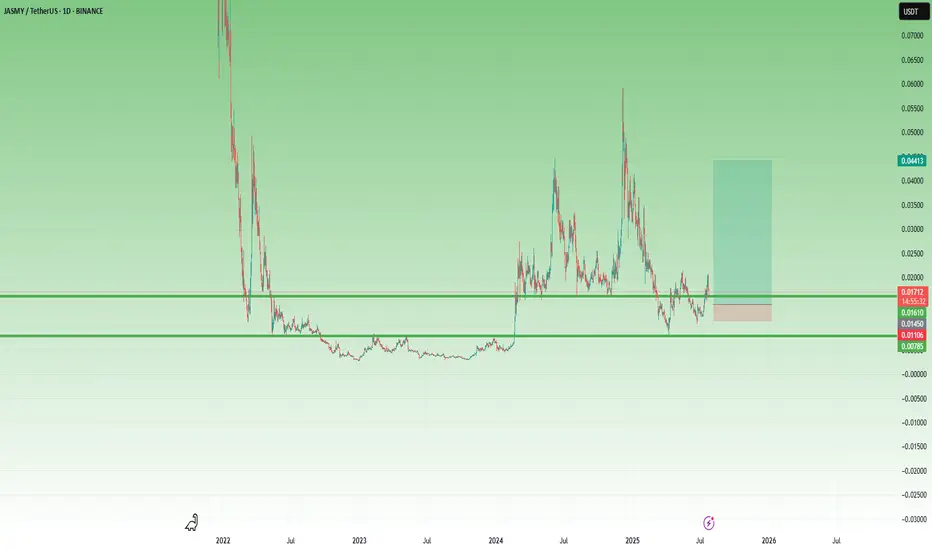
JASMY – Retest After Triangle Breakout📆 On the Daily timeframe, SEED_DONKEYDAN_MARKET_CAP:JASMY has broken out of a symmetrical triangle and recently retested the breakout zone successfully ✅. It’s now hovering near the same support, making this a critical level to monitor.
This kind of post-breakout retest is often seen before conti
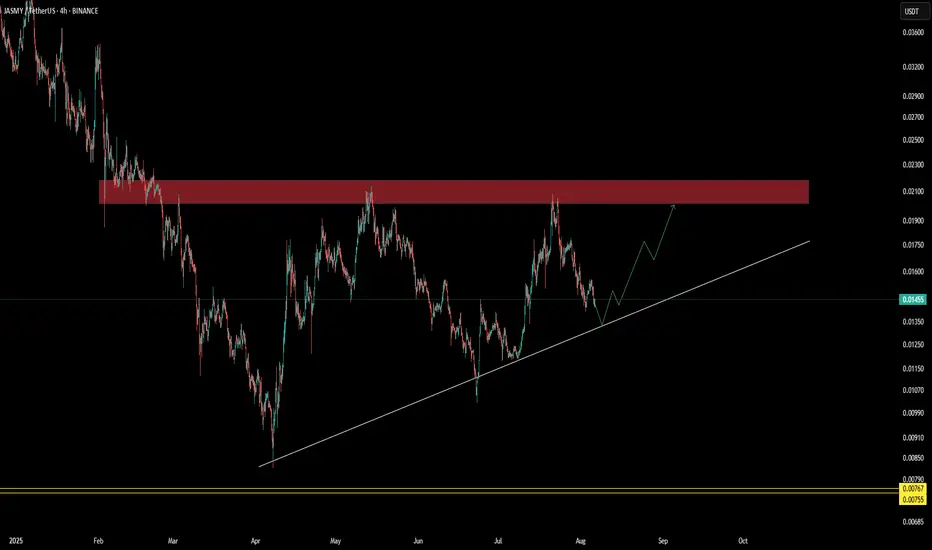
$JASMY ascending triangle patternSEED_DONKEYDAN_MARKET_CAP:JASMY price is hovering near the support trendline, and the chart is forming a bullish structure with consistent higher lows.
If the price manages to hold, this could be a good buy zone near support IMO.
Sell biasPrice changed character on the higher timeframe and is creating lower highs and lower lows
Price tapped into the premium zone of previous 4H structure
Internal break of structure with mitigation block formed
Entry at mitigation block

Jasmyusdt Buy opportunityJASMYUSDT is displaying a strong cup and handle formation, presenting a good accumulation opportunity within the highlighted zone. The provided targets on the chart align with the coin’s potential, making it a worthwhile hold.
Previous analysis, which identified an Adam and Eve pattern, played ou

JASMY – A Volatile Setup with x3 Potential 🔸 After bottoming out at 0.003 and spending over a year in accumulation, JASMY finally broke above the key 0.008 resistance zone in February 2024. That breakout triggered a series of explosive moves – but just as violent were the drops that followed.
🔸 What stands out:
• The first post-breakout s
JASMY/USDT – End of the Bearish Era? Golden Pocket Retest?🧠 Technical Overview:
The JASMY chart is showing a very strong technical signal after breaking out from a major descending trendline that had capped the price since December 2024. This breakout marks the potential end of a medium-term bearish phase and the beginning of a new accumulation and bullish

JASMYUSDT?
Hi
Looking bullish. Inside bar
Need to have patience for it to move away from this level
All the best
Not a guru

See all ideas
Summarizing what the indicators are suggesting.
Oscillators
Neutral
SellBuy
Strong sellStrong buy
Strong sellSellNeutralBuyStrong buy
Oscillators
Neutral
SellBuy
Strong sellStrong buy
Strong sellSellNeutralBuyStrong buy
Summary
Neutral
SellBuy
Strong sellStrong buy
Strong sellSellNeutralBuyStrong buy
Summary
Neutral
SellBuy
Strong sellStrong buy
Strong sellSellNeutralBuyStrong buy
Summary
Neutral
SellBuy
Strong sellStrong buy
Strong sellSellNeutralBuyStrong buy
Moving Averages
Neutral
SellBuy
Strong sellStrong buy
Strong sellSellNeutralBuyStrong buy
Moving Averages
Neutral
SellBuy
Strong sellStrong buy
Strong sellSellNeutralBuyStrong buy
Displays a symbol's price movements over previous years to identify recurring trends.