EURJPY Will Go Down! Short!
Please, check our technical outlook for EURJPY.
Time Frame: 6h
Current Trend: Bearish
Sentiment: Overbought (based on 7-period RSI)
Forecast: Bearish
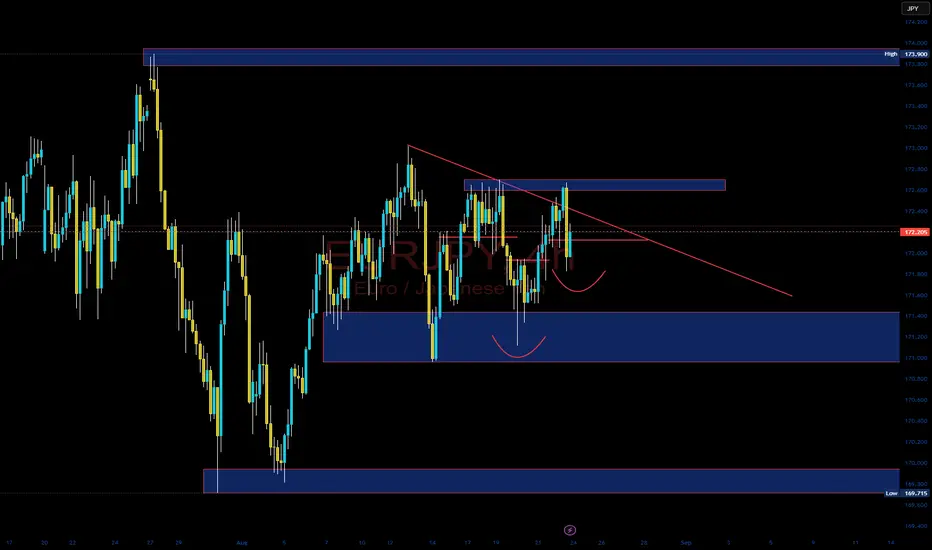
The market is approaching a significant resistance area 172.417.
Due to the fact that we see a positive bearish reaction from the underlined area, I strongly believe that sellers will manage to push the price all the way down to 171.660 level.
P.S
The term oversold refers to a condition where an asset has traded lower in price and has the potential for a price bounce.
Overbought refers to market scenarios where the instrument is traded considerably higher than its fair value. Overvaluation is caused by market sentiments when there is positive news.
Disclosure: I am part of Trade Nation's Influencer program and receive a monthly fee for using their TradingView charts in my analysis.
Like and subscribe and comment my ideas if you enjoy them!
JPYEUR trade ideas


Short trade Pair: EUR/JPY
Date/Time: Sun 31 Aug 25 – 10:50 pm
Session: Tokyo Session PM
Timeframe: 15m
Trade Type: Sell-side
📊 Trade Parameters
Entry: 172.105
Stop Loss: 172.203 (0.06%)
Take Profit: 171.603 (0.29%)
Risk/Reward Ratio: 5.12: 1
🕵 Observations
Entry refined during Tokyo session PM after rejection of VWAP (172.119).
Market structure indicated bearish order flow at intraday premium.
Strong alignment with TWM & VWAP rejection provided an entry trigger.
Volume spike on rejection wick confirmed liquidity grab before downside move.
✅ Trade Narrative
Price action formed a sweep above the 172.10 –172.20 zone, rejecting VWAP and Tokyo session highs. Entry placed at 172.105 with a tight stop at 172.203. Target aligned with liquidity pool near 171.60, producing a high-RR setup (5.12R). Execution matches broader bearish structure from higher timeframe.
15min TF overview

EUR/JPY - Distribution PhaseEUR/JPY – Potential Distribution Phase
🕰 Monthly View
We are inside a Wave (5) extension, with price testing above the 173.000 handle.
Strong historical supply/resistance zone is capping upside momentum.
Bias remains cautiously bullish long-term, but we may be forming a macro top before retracement.
📉 Daily View
Price reacted perfectly from the 71% retracement zone (classic rejection).
Currently consolidating inside a wedge pattern.
Daily active supply between 172.200 – 173.000 is holding, acting as a ceiling.
If structure breaks down, watch for liquidity sweep into the 167.500–168.000 demand zone.
⏱ 1H/Intraday View
Accumulation phase has been spotted with a manipulation wick (highlighted).
Resistance is active near 172.000, where sellers continue defending.
Breakdown below 171.200 (collapsed support) could confirm bearish continuation into 170.900 → 170.000 targets.
Short-term bullish relief possible, but likely to be capped at supply for a distribution sell-off setup.
🎯 Trade Zones
Sell Setup (High Probability):
Entries: 171.800 – 172.200 (active resistance/supply).
Targets: 170.900 → 170.000 → 167.700 (major demand).
Invalidation: Clean break above 173.000 would invalidate short bias and open bullish continuation.
⚖️ Bias
Medium-Term: Bearish toward 170.000 → 167.700.
Long-Term: Bullish as long as monthly Wave (5) holds above 165.000.
🔑 Patience is key — waiting for supply rejection before entries.


EURJPY Bearish Reversal TradeEURJPY has been Trending Upside untill it reached a Supply Zone, the market broke the last HL which makes BOS no we are waiting the market to come back to the Ectreme Supply Zone.

EUR/JPY (Daily > M15)1. Pair & Timeframe
Pair: EUR/JPY
Timeframe: 15M (M15)
Higher timeframe context: H1 & H4 for overall trend direction and key zones.
2. Market Structure
Price previously traded in a bearish channel (descending trendline visible on the chart).
Currently, price is near the demand zone (gray area at the bottom), signaling potential reaction.
Previous supply zone is clearly marked at the top (blue area), which is a major resistance.
3. Key Zones
Supply Zone (Resistance): 172.445 – 172.748 (blue zone at the top).
Strong area where sellers previously pushed price down.
Demand Zone (Support): 171.316 – 171.579 (gray zone at the bottom).
Price is currently testing this demand area.
4. Validation & Bias
Price is inside the demand zone after a downward move within a channel.
Watch for bullish confirmation on M5/M15 (e.g., rejection wicks, bullish engulfing) for a potential buy setup.
If demand fails and price breaks below 171.300, bearish continuation is likely.
5. Trade Plan
Buy Setup:
Entry: Within 171.316 – 171.579 after bullish confirmation.
SL: Below 171.300 (safe buffer).
TP1: 171.930 (minor structure).
TP2: 172.445 (previous supply zone).
Risk to Reward: Minimum 1:2 or better.
6. Alternative Scenario
If price fails to hold demand and closes below 171.300, expect a continuation to the downside toward 171.000 and lower levels.
✅ Bias: Bullish if demand zone holds, bearish if broken.
✅ Key Idea: Wait for confirmation before entering, as price is at a critical zone.

EURJPY My Opinion! BUY!
My dear followers,
This is my opinion on the EURJPY next move:
The asset is approaching an important pivot point 171.50
Bias - Bullish
Technical Indicators: Supper Trend generates a clear long signal while Pivot Point HL is currently determining the overall Bullish trend of the market.
Goal - 172.00
About Used Indicators:
For more efficient signals, super-trend is used in combination with other indicators like Pivot Points.
Disclosure: I am part of Trade Nation's Influencer program and receive a monthly fee for using their TradingView charts in my analysis.
———————————
WISH YOU ALL LUCK

Long trade
15min TF overview
Pair: EURJPY
Direction: Buyside trade
Date: Friday, 22nd August 2025
Time: 2:14 PM (NY Session PM)
Timeframe: 15min TF Entry
🔹 Trade Parameter
Entry: 172.150
Profit Target: 172.547 (+0.23%)
Stop Loss: 172.100 (-0.03%)
Risk-Reward Ratio (RR): 7.94
🔹 Trade Narrative
Entry taken during NY Session PM following liquidity sweep and confirmation at the 15m timeframe. Set up aligned with session price action (PA) and targeting continuation in line with intraday bullish bias—Target Opening Range (9:30 am NY) levels used as reference point for execution. Tight stop placement reflects strong conviction in the immediate order flow bias.
🔹 Market Context
Price had consolidated after rejecting lower levels, showing accumulation before a breakout.
Session liquidity engineered around VWAP (172.27) and ORL/ORI (172.354), which provided confluence for entry. Volume supported upward momentum after rejection of lower NY lows.


Sell Idea EJBias: Short-term sell after liquidity grab.
Entry: 172.35–172.64 (resistance zone).
Stop Loss: Above 172.95.
Targets:
TP1: 171.90
TP2: 171.76
TP3: 171.54
Risk/Reward: ~1:2 if full target hit.
Key Note: Setup anticipates a stop-hunt above resistance before reversal.

uptrend I still see the market pushing up some more up to the 172.601+ area, if it breaks past that area the uptrend still continues. We did have a big drop to the downside, but the market tested that area back to the 172.205 and could potentially show continuation to the upside still creating higher lows on the higher TF (4hr) and (15min). That major drop is coming soon but the bulls are in control now we shall see what the market will do the upcoming week.
entry at 171.890
SL at 171.784
TP at 172.632
Bullish trend in the EURJPY pairTaking my trade using simple Dow theory and bullish trend in the EURJPY pair

EUR/JPY BUY It look like the market have strong buyers in trend so I go with up side with the trend line

EURJPY: Bearish Continuation & Short Trade
EURJPY
- Classic bearish setup
- Our team expects bearish continuation
SUGGESTED TRADE:
Swing Trade
Short EURJPY
Entry Point - 172.05
Stop Loss - 172.21
Take Profit - 171.73
Our Risk - 1%
Start protection of your profits from lower levels
Disclosure: I am part of Trade Nation's Influencer program and receive a monthly fee for using their TradingView charts in my analysis.
❤️ Please, support our work with like & comment! ❤️


Bearish EurJpy is bearish on daily time frame same as 4hrs tf.then I'd bearish engulfing
candle on 1hr tf on Resistance 172.000

EURJPY Short SetupI’m looking for a short opportunity on EURJPY around 172.545. The pair is showing signs of exhaustion near recent highs, with momentum stalling at a key resistance zone. Structure suggests a potential reversal, supported by rejection wicks and weakening bullish follow-through.
Entry: 172.545
Stop Loss: 172.865 (above recent swing high / resistance)
Target: 170.000 (major support level & clean liquidity zone)
This setup offers a solid risk-to-reward ratio of roughly 1:8, targeting a move back toward the lower structure support. If price invalidates and closes above 172.865, I’ll consider this idea void.
📉 Bias remains short while below resistance.

EURJPY short term analysis - 19-8-2025
On the EJ 4H chart, the recent swing high has been confirmed based on several 4H rejection candles. This move is supported by the Yen Futures Index, which raided the PDL liquidity and closed above it.
Sell Target: The next 1H order block below.

EURJPY SELL!!Price is showing bearish signs, noticed price made an impulsive move to the downside, rallying back up to clear liquidity and continue its move downwards

EUR/JPY Bounces Back Ahead of Monthly LowEUR/JPY seems to be bouncing back ahead of the monthly low (169.82) as it holds above the 170.70 (161.8% Fibonacci extension) to 170.90 (78.6% Fibonacci retracement) region, with a breach of the monthly high (173.02) bringing the July high (173.90) on the radar.
Next area of interest comes in around the 2024 high (175.43), but lack of momentum to hold above the 170.70 (161.8% Fibonacci extension) to 170.90 (78.6% Fibonacci retracement) region may push EUR/JPY toward 169.20 (161.8% Fibonacci extension).
Failure to defend the July low (168.46) opens up 167.40 (61.8% Fibonacci retracement), with the next area of interest coming around 164.90 (50% Fibonacci retracement).
--- Written by David Song, Senior Strategist at FOREX.com
