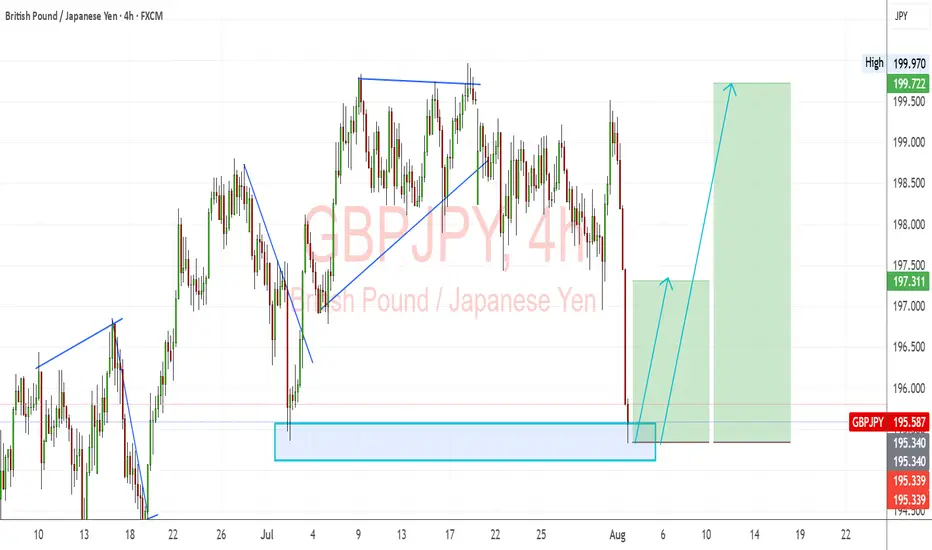
GBPJPY: Strong Bullish Reversal from Demand ZoneGBPJPY has bounced sharply from a key demand zone, indicating renewed bullish momentum. The pair continues to follow the broader bullish bias in GBP crosses, with JPY weakness driven by the Bank of Japan's dovish policy stance.
Technical Analysis (4H Chart)
Pattern: Bullish rejection from the 195.30–195.50 demand zone.
Current Level: 195.58, rebounding from strong support, setting up for a potential upward leg.
Key Support Levels:
195.34 – immediate demand zone and critical support.
194.90 – deeper backup support if a pullback occurs.
Resistance Levels:
197.31 – near-term resistance and first upside target.
199.72 – extended target if bullish continuation strengthens.
Projection: As long as 195.34 holds, GBP/JPY could push toward 197.31, with potential for 199.72 if GBP strength persists.
Fundamental Analysis
Bias: Bullish.
Key Fundamentals:
GBP: Supported by the BOE’s cautious but tight stance due to persistent inflation pressures.
JPY: Remains fundamentally weak, with the BoJ avoiding major policy tightening while intervention threats only provide short-term support.
Risk Sentiment: Mild risk-on conditions favor GBP over safe-haven JPY.
Risks:
BoJ FX intervention could temporarily strengthen JPY.
A dovish BOE shift could slow GBP momentum.
Key Events:
BOE policy updates and UK CPI.
BoJ commentary and risk sentiment indicators.
Leader/Lagger Dynamics
GBP/JPY is a leader among JPY pairs due to GBP’s volatility and strength. It often outpaces EUR/JPY and CHF/JPY, making it a key pair for JPY sentiment shifts.
Summary: Bias and Watchpoints
GBP/JPY is bullish, with price rebounding from the 195.34 demand zone. Upside targets are 197.31 and 199.72. Watch for BOE communication, BoJ intervention signals, and global risk sentiment for confirmation of the move.
JPYGBP trade ideas
GBPJPY; 600+ PIPS Possible Selling Opportunity GBPJPY has failed to breakthrough 200 price region, suggesting a strong sellers hold. Price behaviour and volume show the same thing. Our target is at 191 which will be a 600 to 700 pips move.
Good luck and trade safe

Today’s Opportunity: Stay Sharp on GBPJPY!Hey friends,
Here's my latest analysis on GBPJPY.
📌 Buy Entry Zone: 197.590 - 197.336
🎯 Target Level: 198.642
📅 Today, major economic data will be released from the U.S.
Make sure to factor this into your fundamental analysis.
📊 It’s not just about the charts—fundamentals matter too.
Technical + Fundamental = Powerful outcomes ✅
💬 Every like and bit of support keeps me going.
Thanks so much to everyone backing this journey! 🙌

GBPJPY: More Growth is Coming! 🇬🇧🇯🇵
GBPJPY will likely bounce from a key daily support,
following a formation of a double bottom pattern
on an hourly time frame.
I think that the price will reach 196.7 level soon.
❤️Please, support my work with like, thank you!❤️
I am part of Trade Nation's Influencer program and receive a monthly fee for using their TradingView charts in my analysis.

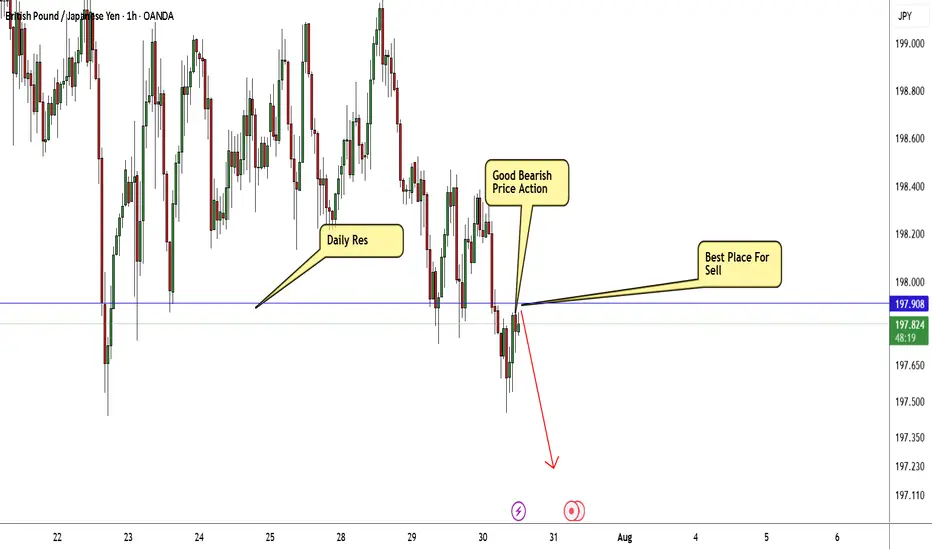
GBPJPY starts corrective downtrend. Ready to SELL✏️ OANDA:GBPJPY has broken the trendline structure and broken the disputed zone. Price is heading towards the support zone ahead around 197.000. This is considered a breakout zone for DCA rather than BUYing at this zone. The downtrend of GBPJPY may extend to the bottom of last week.
📉 Key Levels
SELL now GBPJPY 198.000
SELL trigger: Break support zone 197.000
Target 195.500
Leave your comments on the idea. I am happy to read your views.

GBP/JPY Breakout Done , Short Setup Valid To Get 150 Pips !Here is my 1H Chart on GBP/JPY , We Have A Daily closure below my old support and new res and we have a very good bearish Price Action on 1And 2 Hours T.F , So i see it`s a good chance to sell this pair and targeting 100 to 150 pips . and if we have a daily closure again above my new res then this idea will not be valid anymore .
GJ| Bullish Outlook | IDM + SSL Sweep - OB Reaction(Refined & Structured):
• Pair: GBPJPY
• Bias: Bullish
• 4H Overview: Price broke major highs with bullish structure still intact. After pulling back into discounted territory, I dropped to mid timeframes to anticipate continuation.
• 30M Structure: Price took out sell-side liquidity and IDM, then mitigated a clean internal order block. Structure is refined and showing signs of smart money activity.
• Entry Zone: Watching LTFs for a clean change of character off fresh demand zones.
• Targets: 5M and 30M structural highs depending on delivery.
• Mindset Note: Patience wins here. When structure and liquidity align this clean, all that’s left is letting LTF confirm it. No need to chase—let the setup speak first.

GBPJPY Will Move Higher! Long!
Take a look at our analysis for GBPJPY.
Time Frame: 1h
Current Trend: Bullish
Sentiment: Oversold (based on 7-period RSI)
Forecast: Bullish
The market is approaching a key horizontal level 195.702.
Considering the today's price action, probabilities will be high to see a movement to 197.050.
P.S
Please, note that an oversold/overbought condition can last for a long time, and therefore being oversold/overbought doesn't mean a price rally will come soon, or at all.
Disclosure: I am part of Trade Nation's Influencer program and receive a monthly fee for using their TradingView charts in my analysis.
Like and subscribe and comment my ideas if you enjoy them!

GBPJPY - Catching The Falling Knife... ConservativelyDon't catch the falling knife! This is a common warning in the trading industry. Although i do agree with it (in some circumstances), I think what's more important is for us to perform analysis and be confident on where that knife may find a floor at.
In the case of the OANDA:GBPJPY I think we've seen that floor which may present us with the opportunity to but IF... I say if because simply making that prediction isn't enough. As a trade, what I want to see if some sort of signal from the market (while at that level) that price is more likely to do what I predict, than not.
If you have any questions, comments or want to share your views, please do so below. Also be sure to hit that like button & give me a follow, that way you don't miss my future trading ideas.
Akil

GBPJPY: Important Demand Zone 🇬🇧🇯🇵
GBPJPY is trading within an important demand zone that
is based on a rising trend line and a horizontal support.
We see a false violation of that and a bear trap, followed
by a bullish imbalance candle.
I think that the pair may go up and reach at least 198.08 level.
❤️Please, support my work with like, thank you!❤️
I am part of Trade Nation's Influencer program and receive a monthly fee for using their TradingView charts in my analysis.

GJ SELL SETUP This GBP/JPY 30-minute chart shows a short trade setup based on Smart Money Concepts (SMC), liquidity sweep zones, and session highs/lows. Here's a breakdown of what’s happening:
1) Key Elements Identified in the Chart
Asian Session Range
Asian Highs (Yellow Zone at ~198.471–198.646): Marked as a key liquidity zone.
Asian Lows (Purple Line): Used for liquidity hunting and market structure context.
2) Market Structure
Prior to this setup, price had a bullish structure, forming higher highs.
Eventually, price broke structure to the downside, suggesting a shift to bearish momentum.
3)Liquidity Grabs
Price swept the Asian lows, tapping into sell-side liquidity.
The current move upward looks like a retracement into the Asian highs, likely aiming to grab buy-side liquidity.
4)Entry Zone
The entry is placed just around the Asian highs, targeting the idea that this area will act as a supply zone or breaker block.
Stop Loss (Red Box): Above the liquidity zone, where a breaker would be invalidated.
Take Profit (Green Box): Targeting the recent lows or continuation lower—likely the low around 197.438.
Risk-Reward Ratio
The R:R looks solid—about 2.5–3:1, suggesting a well-balanced trade.
Why This Is a Bearish Setup
Liquidity Sweep: Price ran below Asian lows, collected liquidity, and is now retracing.
Premium Zone: Current price is retracing into a premium zone (above equilibrium) where sellers are expected to re-enter.
Rejection Expected: The idea is that price will reject around 198.5–198.6 (where previous buy stops are likely stacked).

GBPJPY is Holding above the SupportHello Traders
In This Chart GBPJPY HOURLY Forex Forecast By FOREX PLANET
today GBPJPY analysis 👆
🟢This Chart includes_ (GBPJPY market update)
🟢What is The Next Opportunity on GBPJPY Market
🟢how to Enter to the Valid Entry With Assurance Profit
This CHART is For Trader's that Want to Improve Their Technical Analysis Skills and Their Trading By Understanding How To Analyze The Market Using Multiple Timeframes and Understanding The Bigger Picture on the Charts

Trade Idea – GBPJPYBased on the daily market structure and Elliott Wave count, there’s potential for another bullish push to complete Wave 5.
However, on the H4 timeframe, price may still create one more lower low (LL) before confirming the upward move.
🔔 Wait for confirmation — either a break of structure or a bullish engulfing candle on the H1 timeframe before entering any buy positions.
#GBPJPY #ForexAnalysis #ElliottWave #Wave5Setup #UKTraders #USTraders #SwingTrading #PriceAction #ForexStrategy #H1Confirmation

GJ BULLISH SET UPPlace a long on this one, price seems to be at strong support and TL has help price in previous touches.

GBPJPY SellExternal structure is now bearish and the internal structure did a liquidity grab. Price should continue lower and go towards asia low to complete daily cycle.

GBP/JPY BULLS ARE GAINING STRENGTH|LONG
Hello, Friends!
Previous week’s red candle means that for us the GBP/JPY pair is in the downtrend. And the current movement leg was also down but the support line will be hit soon and lower BB band proximity will signal an oversold condition so we will go for a counter-trend long trade with the target being at 197.696.
Disclosure: I am part of Trade Nation's Influencer program and receive a monthly fee for using their TradingView charts in my analysis.
✅LIKE AND COMMENT MY IDEAS✅

GBPJPY ShortGBPJPY is short on the regression break.
I am not taking this trade, as it has terrible roll short and the other GBP and JPY crosses are not following.

SellRejection Level
Daily Volume
Market Structure Shift
Asian Session
Trend Line Break
Untapped Order Point

GBPJPY What Next? SELL!
My dear friends,
Please, find my technical outlook for GBPJPY below:
The price is coiling around a solid key level - 199.08
Bias - Bearish
Technical Indicators: Pivot Points Low anticipates a potential price reversal.
Super trend shows a clear sell, giving a perfect indicators' convergence.
Goal - 198.77
Safe Stop Loss - 199.23
About Used Indicators:
The pivot point itself is simply the average of the high, low and closing prices from the previous trading day.
Disclosure: I am part of Trade Nation's Influencer program and receive a monthly fee for using their TradingView charts in my analysis.
———————————
WISH YOU ALL LUCK

Potential bearish drop?GBP/JPY is reacting off the resitance level which is anoverlap resistance and could drop from this level to our takeprofit.
Entry: 198.05
Why we like it:
There is anoverlap support.
Stop loss: 199.79
Why we like it:
There is a multi swing high resistance.
Take profit: 195.78
Why we like it:
There is a swing low support.
Enjoying your TradingView experience? Review us!
Please be advised that the information presented on TradingView is provided to Vantage (‘Vantage Global Limited’, ‘we’) by a third-party provider (‘Everest Fortune Group’). Please be reminded that you are solely responsible for the trading decisions on your account. There is a very high degree of risk involved in trading. Any information and/or content is intended entirely for research, educational and informational purposes only and does not constitute investment or consultation advice or investment strategy. The information is not tailored to the investment needs of any specific person and therefore does not involve a consideration of any of the investment objectives, financial situation or needs of any viewer that may receive it. Kindly also note that past performance is not a reliable indicator of future results. Actual results may differ materially from those anticipated in forward-looking or past performance statements. We assume no liability as to the accuracy or completeness of any of the information and/or content provided herein and the Company cannot be held responsible for any omission, mistake nor for any loss or damage including without limitation to any loss of profit which may arise from reliance on any information supplied by Everest Fortune Group.

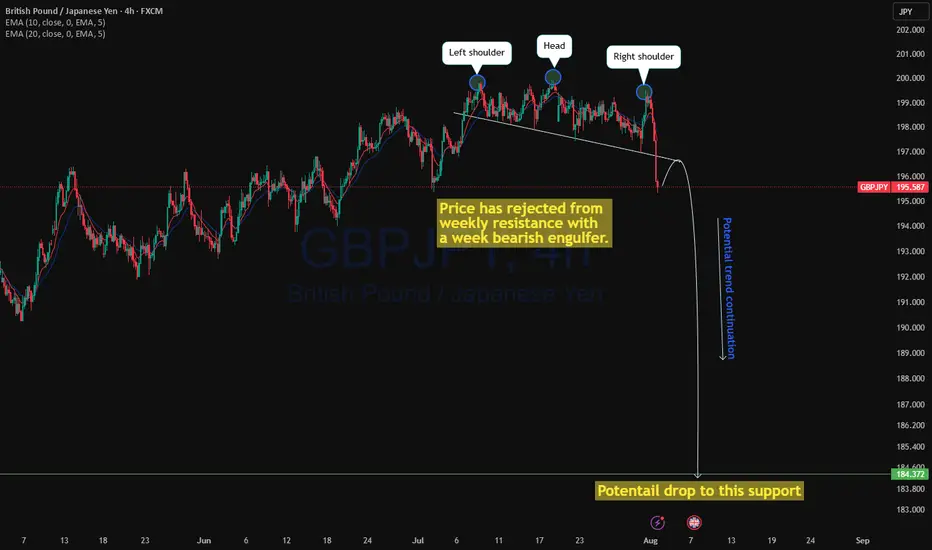
GBPJPY ready to drop?GBPJPY has printed a weekly bearish engulfer with a cross over of a weekly doji and price rejected from a weekly and monthly resistance line. As price is rejecting from a very important monthly and weekly resistance level, it is highly likely price may continue to drop to weekly support level.
As 4H timeframe showing a strong head and shoulder with rejection below, we may see continuation with strong trend.
Upon price action confirmation, a sell trade is high probable.
GBPJPY LONG OPPORTUNITYPrice has returned to a higher time frame demand zone after a clear pullback (retracement) and is now showing signs of rejection, where it has now mitigated previous unfilled buy orders. We’re seeing early signs of bullish intent and anticipate a continuation to the upside as demand takes control.
🔍 Detailed Breakdown:
1. Demand Zone:
• Price recently retraced back into this zone, completing a full mitigation.
• A clear reaction followed, indicating institutional orders may have been filled.
2. Market Structure:
• Previous structure broke to the upside (BOS) confirming shift in intent.
• We anticipate a higher low formation followed by a new higher high, respecting bullish structure.
3. Liquidity Sweep:
• Sell-side liquidity resting below the recent low has been swept before the bullish move began.
• This aligns with institutional behavior: taking out early sellers before raising price.
4. Entry Logic:
• Waiting for a minor retracement or lower timeframe BOS for refined entry.
