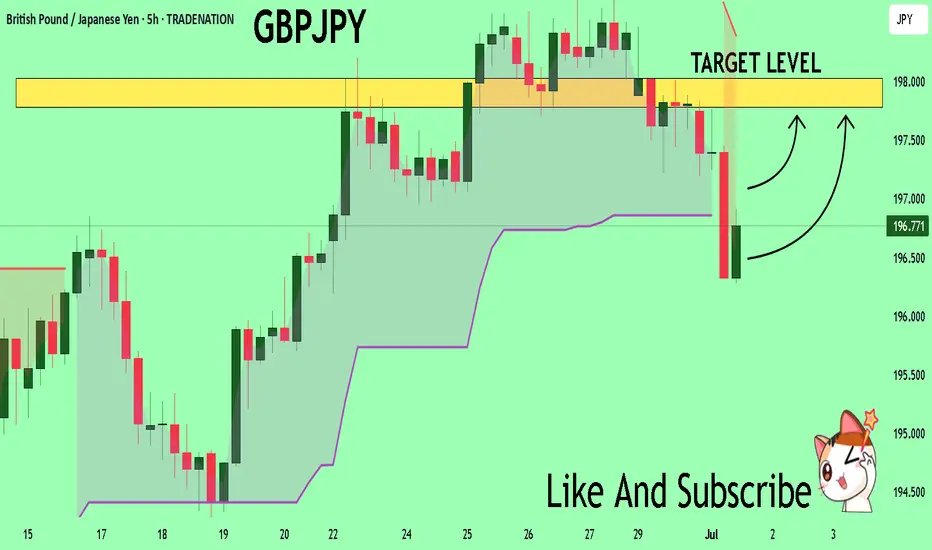
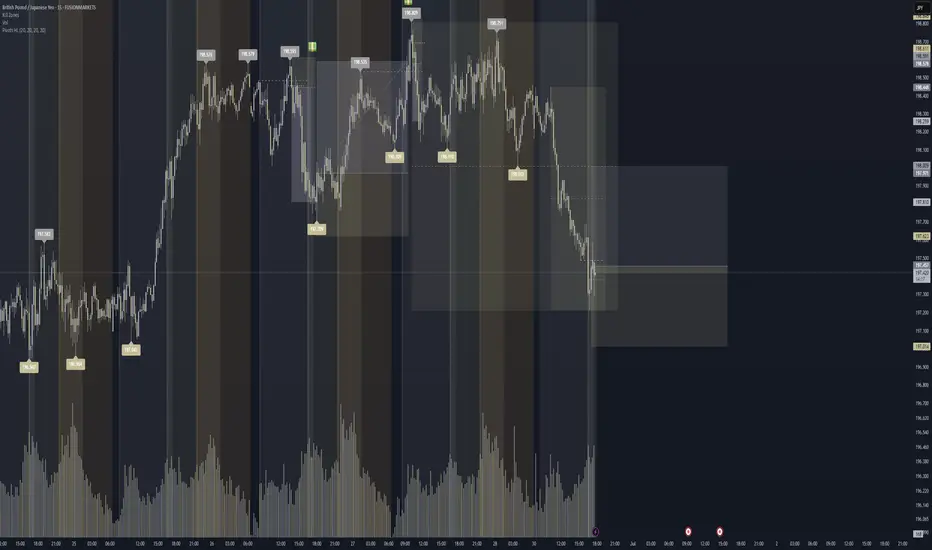
GBPJPY On The Rise! BUY!
My dear friends,
Please, find my technical outlook for GBPJPY below:
The instrument tests an important psychological level 196.72
Bias - Bullish
Technical Indicators: Supper Trend gives a precise Bullish signal, while Pivot Point HL predicts price changes and potential reversals in the market.
Target - 197.78
About Used Indicators:
Super-trend indicator is more useful in trending markets where there are clear uptrends and downtrends in price.
Disclosure: I am part of Trade Nation's Influencer program and receive a monthly fee for using their TradingView charts in my analysis.
———————————
WISH YOU ALL LUCK
JPYGBP trade ideas
GBPJPY Bearish JulyAs usual, at the beginning of each month, we like to have an overview of the current and previous month price action. Price is slowly starting a downtrend. It may be late for entry but this is a huge move in which one is scoring big with sells this July


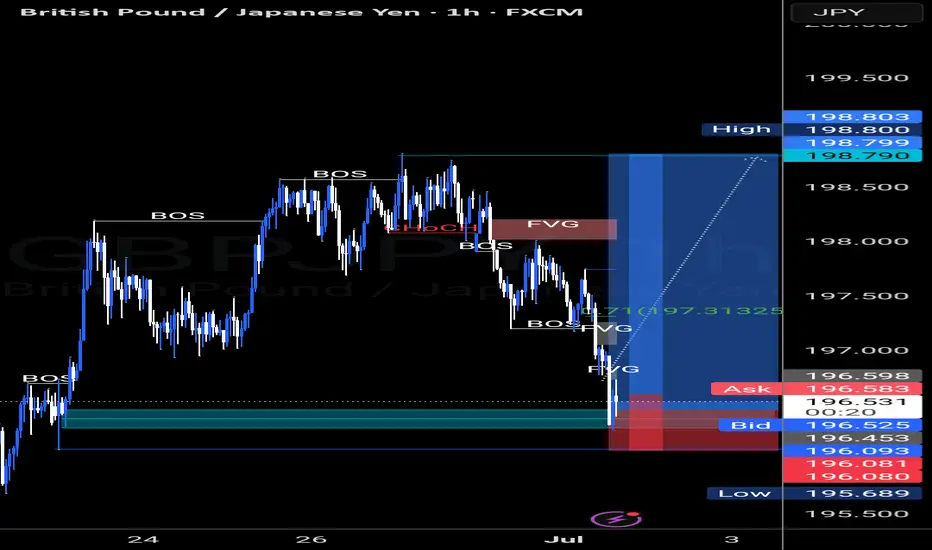
Long on GBPJPY SMC Draft 📈 GBPJPY – Smart Money Story Unfolding 📖
The bears had full control, breaking structure several times and confirming their dominance after a clear CHOCH near 198.200. Each drop left behind footprints—Fair Value Gaps (FVGs) and untapped liquidity—marking where smart money had been active.
But just as the market reached a deep discount zone, price tapped into an unmitigated demand area and swept liquidity below the previous low. Classic smart money behavior—grab the stops, then react.
Now, the bulls have entered the scene with intent. The strong reaction from 195.689–196.080 suggests possible accumulation and a shift in momentum. If this holds, we could see price revisit the upper FVGs around 198.800, where more liquidity awaits.
But if price fails to hold this base, the bearish flow continues. Watch how this story unfolds—liquidity is king, and smart money never sleeps.
GBPJPY SHORT DAILY FORECAST Q3 D1 W27 Y25GBPJPY SHORT DAILY FORECAST Q3 D1 W27 Y25
Professional Risk Managers👋
Welcome back to another FRGNT chart update📈
Diving into some Forex setups using predominantly higher time frame order blocks alongside confirmation breaks of structure.
Let’s see what price action is telling us today! 👀
💡Here are some trade confluences📝
✅Daily Order block identified
✅4H Order Block identified
✅1H Order Block identified
🔑 Remember, to participate in trading comes always with a degree of risk, therefore as professional risk managers it remains vital that we stick to our risk management plan as well as our trading strategies.
📈The rest, we leave to the balance of probabilities.
💡Fail to plan. Plan to fail.
🏆It has always been that simple.
❤️Good luck with your trading journey, I shall see you at the very top.
🎯Trade consistent, FRGNT X

GBP/JPY💰Symbol: { GBP/JPY }
🟩Price: { 197.738 }
🟥Stop: { 199.194 }
1️⃣profit: { 197.018 }
2️⃣profit: { 196.153 }
3️⃣profit: { 195.346 }
4️⃣profit: { 194.346 }
5️⃣profit: { 193.269 }
6️⃣profit: { 192.416 }
📊Check your chart before entering.
🚨Check before use to make sure there is no important news.🚨

GBPJPY H4 XABCD Short at Market TP Below Market🔸Hello traders, let's review the 4 hour chart for GBPJPY. Strong gains off the lows recently, however price getting overextended and expecting reversal later at/near PRZ/D.
🔸Speculative XABCD structure defined by point X 199 point A 188 point B 195.20 point C 186.80 point D/PRZ 198.40/80 .
🔸Currently most points validated, point D/PRZ validated as well.
Short sell at market SL over point D/PRZ TP details see chart
🔸Recommended strategy for GJ traders: Short Sell at Market
SL over point D/PRZ TP1 193.30 TP2 191.00 TP3 188.80.
🎁Please hit the like button and
🎁Leave a comment to support our team!
RISK DISCLAIMER:
Trading Futures , Forex, CFDs and Stocks involves a risk of loss.
Please consider carefully if such trading is appropriate for you.
Past performance is not indicative of future results.
Always limit your leverage and use tight stop loss.

GBP/JPY H4 | Pullback support at 38.2% Fibonacci retracementGBP/JPY is falling towards a pullback support and could potentially bounce off this level to climb higher.
Buy entry is at 196.78 which is a pullback support that aligns closely with the 38.2% Fibonacci retracement.
Stop loss is at 195.60 which is a level that lies underneath a pullback support and the 61.8% Fibonacci retracement.
Take profit is at 198.60 which is a swing-high resistance.
High Risk Investment Warning
Trading Forex/CFDs on margin carries a high level of risk and may not be suitable for all investors. Leverage can work against you.
Stratos Markets Limited (tradu.com ):
CFDs are complex instruments and come with a high risk of losing money rapidly due to leverage. 63% of retail investor accounts lose money when trading CFDs with this provider. You should consider whether you understand how CFDs work and whether you can afford to take the high risk of losing your money.
Stratos Europe Ltd (tradu.com ):
CFDs are complex instruments and come with a high risk of losing money rapidly due to leverage. 63% of retail investor accounts lose money when trading CFDs with this provider. You should consider whether you understand how CFDs work and whether you can afford to take the high risk of losing your money.
Stratos Global LLC (tradu.com ):
Losses can exceed deposits.
Please be advised that the information presented on TradingView is provided to Tradu (‘Company’, ‘we’) by a third-party provider (‘TFA Global Pte Ltd’). Please be reminded that you are solely responsible for the trading decisions on your account. There is a very high degree of risk involved in trading. Any information and/or content is intended entirely for research, educational and informational purposes only and does not constitute investment or consultation advice or investment strategy. The information is not tailored to the investment needs of any specific person and therefore does not involve a consideration of any of the investment objectives, financial situation or needs of any viewer that may receive it. Kindly also note that past performance is not a reliable indicator of future results. Actual results may differ materially from those anticipated in forward-looking or past performance statements. We assume no liability as to the accuracy or completeness of any of the information and/or content provided herein and the Company cannot be held responsible for any omission, mistake nor for any loss or damage including without limitation to any loss of profit which may arise from reliance on any information supplied by TFA Global Pte Ltd.
The speaker(s) is neither an employee, agent nor representative of Tradu and is therefore acting independently. The opinions given are their own, constitute general market commentary, and do not constitute the opinion or advice of Tradu or any form of personal or investment advice. Tradu neither endorses nor guarantees offerings of third-party speakers, nor is Tradu responsible for the content, veracity or opinions of third-party speakers, presenters or participants.

GBPJPY- Sell on rallies The GBP/JPY lost its shine on board-based yen buying. It hit an intraday low of 197.01 and is currently trading around 197. Intraday trend is bearish as long as the resistance at 197.75 holds.
The GBP/JPY pair is trading below 34 and above 55 and 200 EMA (Short-term) and 365 EMA (long-term) on the 15-min chart, confirming a bearish trend. Any violation below 196.70 indicates the intraday trend is weak. A dip to 196/195/194/193.70 is possible. Immediate resistance is at 197.75 a breach above this level targets of 198.35/198.80/200/202.
Market Indicators (15 min chart)
CCI (50)- Bearish
Directional movement index - Bearish
Trading Strategy: buy on dips
It is good to sell on rallies around 197.18-20 with SL around 197.75 for a TP of 195.

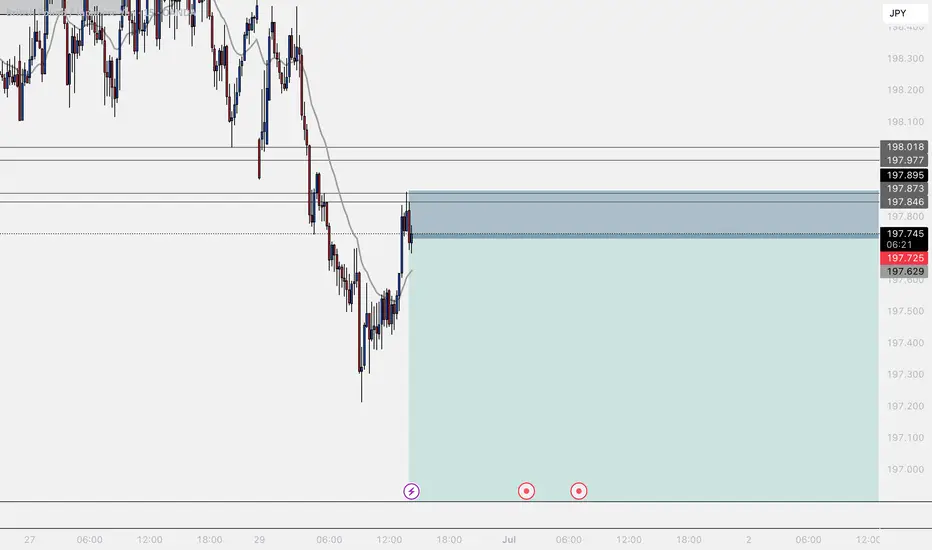
GJ-Tue-01/07/25 TDA-Lots of speeches in NY, including BoJ Analysis done directly on the chart
Follow for more, possible live trades update!
I often share my live trades in Tradingview public chat in London session, stay tuned!
Being consistently profitable is not equal to be simply profitable.
Many but many claims that they are consistently profitable but
they need years of track record to be able to say that and not
months of track record.
Active in London session!
Not financial advice, DYOR.
Market Flow Strategy
Mister Y

GBPJPY STARTED FORMING BEARISH TREND STRUCTUREGBPJPY STARTED FORMING BEARISH TREND STRUCTURE.
Market is forming lower low, which indicates downtrend in 30 minutes time frame charts.
Market was trading in secondary trend from lest few sessions.
Candlestick reversal pattern can be shown at the top of secondary trend.
market is expected to remain bearish for upcoming sessions.
On lower side market may hit the targets of 194.90 and 194.30.
On higher side 196.45 can be major resistance level.

Bearish ContinuationI am expecting price to continue lower after mitigation of 5m Confirmation MSS supply zone.


What ha think??This is what I think the market is going to do this coming days ,show your thoughts and let’s make money together. Let’s make it…… let’s go.!!
GBPJPY SELL IDEAPrice reached a daily resistance last week and respected it. The price was consolidating and finally broke the previous low (support) on the H4 chart, forming a lower low and signaling the beginning of a downtrend/fall.
I'm on the lookout for a retest of the broken support on H1 for entry for a sell to the next low.
Risk - 30 pips
Reward - 172 pips


GBPJPY TRADE IDEA We're looking at a continuation trade to the upside on GBPJPY
Let's see the reaction of the market.
What will the market do.

GBPJPY Long – Liquidity Sweep & Bullish Shift from Discount Pric
Price swept key sellside liquidity at 197.489, forming a clean external W pattern in deep discount territory. A bullish engulfing candle followed, closing above the internal shift point and reclaiming structure just beneath 198.012 (yesterday’s low). Entered long on confirmed shift with TP set at box equilibrium (EQ) and stop loss placed below the pattern base. Setup aligns with liquidity theory, structure reclaim, and smart money accumulation.
GBPJPY SHORT DAILY FORECAST Q3 D30 W27 Y25GBPJPY SHORT DAILY FORECAST Q3 D30 W27 Y25
Professional Risk Managers👋
Welcome back to another FRGNT chart update📈
Diving into some Forex setups using predominantly higher time frame order blocks alongside confirmation breaks of structure.
Let’s see what price action is telling us today! 👀
💡Here are some trade confluences📝
✅Daily Order block identified
✅4H Order Block identified
✅1H Order Block identified
🔑 Remember, to participate in trading comes always with a degree of risk, therefore as professional risk managers it remains vital that we stick to our risk management plan as well as our trading strategies.
📈The rest, we leave to the balance of probabilities.
💡Fail to plan. Plan to fail.
🏆It has always been that simple.
❤️Good luck with your trading journey, I shall see you at the very top.
🎯Trade consistent, FRGNT X

GBP/CAD (Two Trade Recaps) EUR/NZD Long and GBP/JPY LongEUR/NZD Long
Minimum entry requirements:
- If tight non-structured 15 min continuation forms, 5 min risk entry within it if the continuation is structured on the 5 min chart or reduced risk entry on the break of it.
- If tight structured 15 min continuation forms, reduced risk entry on the break of it or 15 min risk entry within it.
- If tight non-structured 1H continuation forms, 15 min risk entry within it if the continuation is structured on the 15 min chart or reduced risk entry on the break of it.
- If tight structured 1H continuation forms, 1H risk entry within it or reduced risk entry on the break of it.
GBP/JPY Long
Minimum entry requirements:
- Tap into area of value.
- 1H impulse up above area of value.
- If tight non-structured 15 min continuation follows, 5 min risk entry within it if the continuation is structured on the 5 min chart or reduced risk entry on the break of it.
- If tight structured 15 min continuation follows, reduced risk entry on the break of it or 15 min risk entry within it.

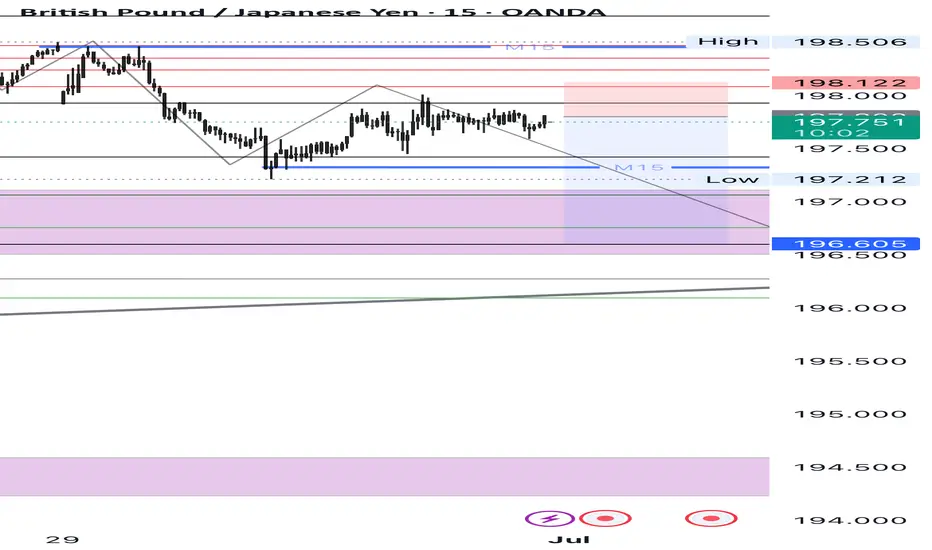
GBP/JPY Trades Lower After Breaching 198.0 SupportGBP/JPY declined from recent highs, currently trading around 197.3. The break below Friday’s 198.0 low intensified the downtrend, with the pair nearing a key support at 196.9.
A temporary rebound toward 198.0 is possible before the downtrend resumes toward 196.0. The bearish outlook is invalidated if GBP/JPY breaks above 198.9.

GBPJPY Eyes 200 BoJ Dovishness & Bullish UK SentimentGBPJPY pair has staged a decisive breakout from a multi-day consolidation zone, with technical momentum and macro fundamentals aligning in favor of further upside. Price action has respected a bullish continuation structure — a falling wedge followed by horizontal accumulation — and is now pressing toward the psychological 200.00 level. With the Bank of England holding firm on policy and the Bank of Japan maintaining its ultra-loose stance, GBPJPY presents one of the strongest carry trade setups in the market. Here's a breakdown of what’s driving this move and what to watch next:
📈 Current Bias: Bullish
The pair has confirmed a bullish breakout above the 198.80–198.95 resistance zone, targeting higher fib extensions at 199.40 and 200.00. Momentum is clearly on the bulls’ side as GBPJPY follows through on a textbook pattern breakout.
🔍 Key Fundamentals:
Bank of Japan’s Dovish Stance: The BoJ continues to resist any significant tightening, reaffirming yield curve control and negative real yields. This keeps the yen fundamentally weak, especially against higher-yielding currencies.
Bank of England’s Hawkish Hold: Despite global easing signals, the BoE remains cautious and data-dependent, with inflation still sticky in the UK. This underpins GBP strength relative to the yen.
Global Risk Appetite: Strong equity markets, especially the US500 rally, reduce demand for the safe-haven JPY and increase appetite for high-yielding cross pairs like GBPJPY.
⚠️ Risks to the Trend:
Safe-Haven Shocks: Any sudden geopolitical tension (e.g., Middle East, US-China trade rhetoric) may trigger JPY demand and reverse the bullish flow.
Unexpected BoE Dovish Pivot: A surprise in UK inflation or dovish commentary from the BoE could weaken GBP momentum.
JPY Intervention Risks: With the yen near historically weak levels, any threat or action from Japan’s Ministry of Finance or verbal intervention by BoJ officials could spark sudden volatility.
📅 Key News/Events Ahead:
Japan’s Tankan Survey (June 30): May influence BoJ tone.
UK Final Manufacturing PMI (July 3): A key gauge for growth momentum.
BoE Governor Bailey Speech (July 5): Any hints on policy trajectory will be market-moving.
US NFP & Global Risk Sentiment: Impacts broader carry trade appetite.
⚖️ Leader or Lagger?
GBPJPY is a leader — it often acts as the flagship pair for carry trade demand. Moves in GBPJPY frequently guide sentiment across other JPY pairs like CADJPY, AUDJPY, and NZDJPY, especially when driven by macro divergences. Its high beta to risk sentiment also makes it a prime barometer for global financial mood.
🎯 Conclusion:
GBPJPY has momentum, macro divergence, and a clean technical setup on its side. The breakout above consolidation favors a continued rally toward 199.40 and possibly 200.00. While geopolitical or policy shocks remain risks, the current backdrop supports staying bullish while above the 197.65 invalidation level.
