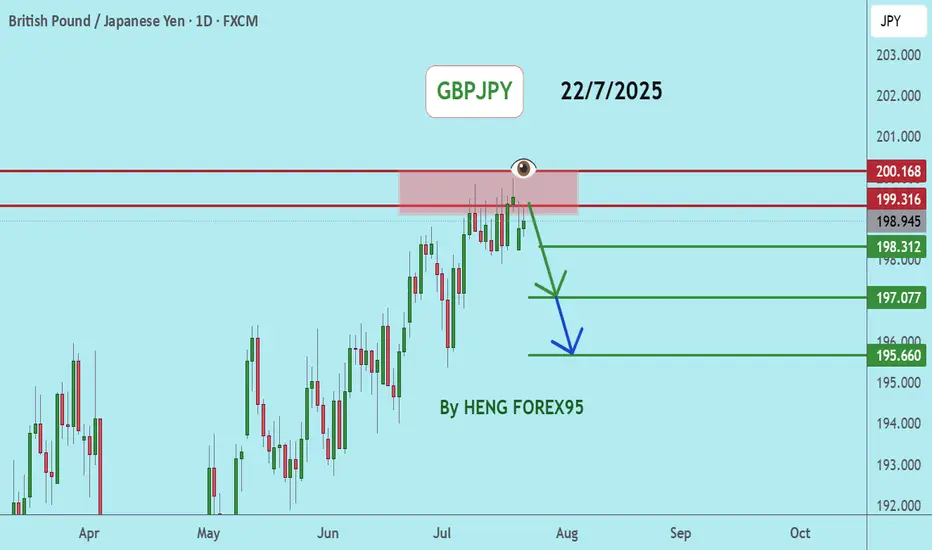
GBPJPYGBPJPY price is near the main resistance zone 200.168. If the price cannot break through the 200.186 level, it is expected that the price will go down. Consider selling the red zone.
🔥Trading futures, forex, CFDs and stocks carries a risk of loss.
Please consider carefully whether such trading is suitable for you.
>>GooD Luck 😊
❤️ Like and subscribe to never miss a new idea!
JPYGBP trade ideas
GBP/JPY H4 | Bullish bounce offGBP/JPY is falling towards the buy entry, which is an overlap support that lines up with the 61.8% Fibonacci retracement and could bounce to the take profit.
Buy entry is at 197.99, which is an overlap support that aligns with the 61.8% Fibonacci retracement.
Stop loss is at 196.90, which is a swing low support.
Take profit is at 199.73, which is a multi-swing high resistance.
High Risk Investment Warning
Trading Forex/CFDs on margin carries a high level of risk and may not be suitable for all investors. Leverage can work against you.
Stratos Markets Limited (tradu.com ):
CFDs are complex instruments and come with a high risk of losing money rapidly due to leverage. 65% of retail investor accounts lose money when trading CFDs with this provider. You should consider whether you understand how CFDs work and whether you can afford to take the high risk of losing your money.
Stratos Europe Ltd (tradu.com ):
CFDs are complex instruments and come with a high risk of losing money rapidly due to leverage. 66% of retail investor accounts lose money when trading CFDs with this provider. You should consider whether you understand how CFDs work and whether you can afford to take the high risk of losing your money.
Stratos Global LLC (tradu.com ):
Losses can exceed deposits.
Please be advised that the information presented on TradingView is provided to Tradu (‘Company’, ‘we’) by a third-party provider (‘TFA Global Pte Ltd’). Please be reminded that you are solely responsible for the trading decisions on your account. There is a very high degree of risk involved in trading. Any information and/or content is intended entirely for research, educational and informational purposes only and does not constitute investment or consultation advice or investment strategy. The information is not tailored to the investment needs of any specific person and therefore does not involve a consideration of any of the investment objectives, financial situation or needs of any viewer that may receive it. Kindly also note that past performance is not a reliable indicator of future results. Actual results may differ materially from those anticipated in forward-looking or past performance statements. We assume no liability as to the accuracy or completeness of any of the information and/or content provided herein and the Company cannot be held responsible for any omission, mistake nor for any loss or damage including without limitation to any loss of profit which may arise from reliance on any information supplied by TFA Global Pte Ltd.
The speaker(s) is neither an employee, agent nor representative of Tradu and is therefore acting independently. The opinions given are their own, constitute general market commentary, and do not constitute the opinion or advice of Tradu or any form of personal or investment advice. Tradu neither endorses nor guarantees offerings of third-party speakers, nor is Tradu responsible for the content, veracity or opinions of third-party speakers, presenters or participants.

GBPJPY ShortGBPJPY is now net short on the regression break.
I am considering all JPY pairs as it appears a market correction may build.


SELL BIAS ON GBPJPYWith price potentially making a shift from buyside to sell side. There will be lots of sell sentiments this week.

GBPJPY recent global risk appetite significantly increasedThrough the dynamic monitoring of market sentiment and capital flows found that the recent global risk appetite significantly increased, the structure of funds tilted to risky assets, the currency benefited from this trend to show upward momentum.
Public opinion analysis shows that the market is generally concerned about the positive impact of economic recovery and policy support, and media reports and analysts' views tend to be optimistic, which strengthens the bullish market atmosphere.
Money flow data supports the active inflow of funds into the currency, showing a combination of institutional and retail buying, pushing the price to stabilize and rebound.
It is recommended that investors combine the dynamic, reasonably adjust the position, low absorption, and actively participate in the market rebound.

GBP JPY Another sell opportunityIn my previous analysis, I mentioned that GBP/JPY would turn bearish — and it dropped beautifully, around 280 pips.
Now, a new sell opportunity is setting up, and we can look to enter another short position.

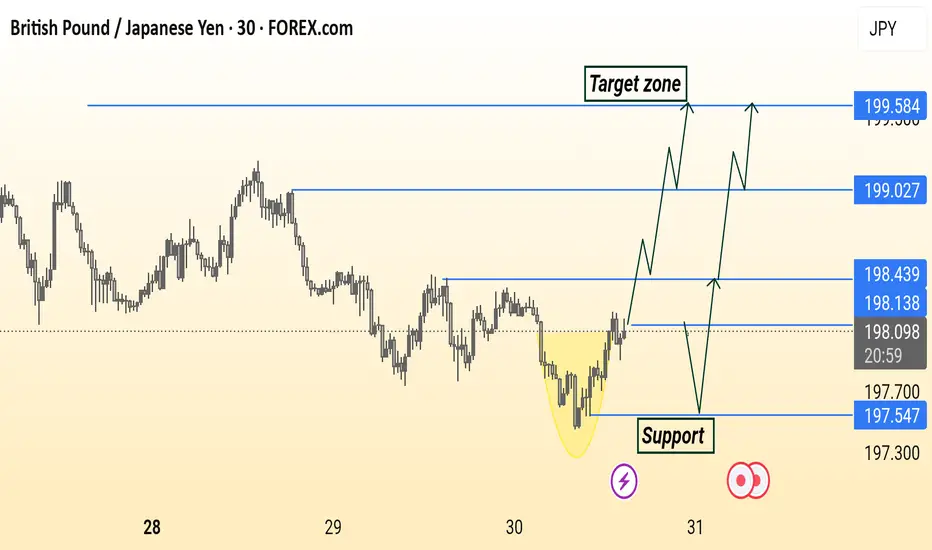
GBP/JPY Analysis is Ready Read The Captions GBP/JPY 30-minute chart shows a potential bullish reversal from a rounded bottom pattern. Price is approaching support around 198.13–197.54, with multiple possible bullish scenarios targeting resistance levels at 198.43, 199.03, and 199.58. The highlighted “Target zone” suggests a continuation if price breaks and holds above key resistance.
GBPJPY: Bearish Market StructureLook to sell after the correction...
(H4)
✅ Confirmed BOS below 197.20
✅ LHs
✅ Supply Zone: 196.10 – 196.60
(H1)
✅ Nice impulse down from 197.30 to 195.50
✅ Short-Term Supply Zone: 195.90 – 196.20 (H1 OB inside H4)
Looking for price to tap this zone and form a new LH
(M15)
✅ Price consolidating after the drop
✅ No bullish BOS
✅ New LH
Expecting liquidity sweep above 195.90, then bearish BOS below 195.70 to confirm entry
❌ Invalidation: Bullish BOS above 196.70 on M15.

GBPJPY Will Fall!
HI,Traders !
#GBPJPY has retested a
Horizontal resistance level
Of 198.903 so we are
Locally bearish biased
And from the resistance we
We will be expecting a
Local bearish correction !
Comment and subscribe to help us grow !


GBPJPY MADE EASY >> SELL Sell after break of trendline but cautious of pullbacks. With recent YEN strength, downside prevails.

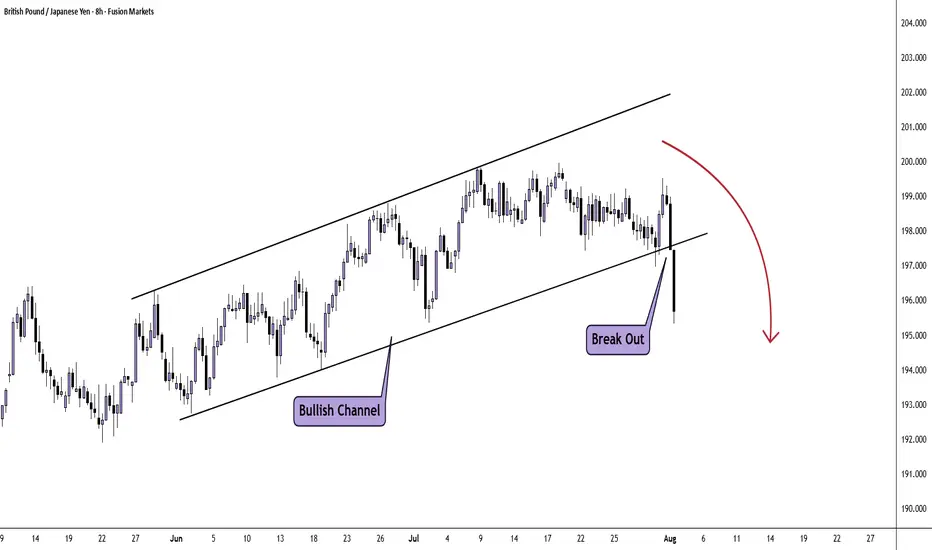
GBP/JPY H8 AnalysisPrice has been bullish since April this year with the most recent price action forming a parallel channel.
On Friday we saw a solid break lower and close below the channel. This could possibly lead to further downside.
Look for a trade that meets your strategy rules.
GBP-JPY Risky Long! Buy!
Hello,Traders!
GBP-JPY collapsed on Friday
And the pair's final move
Was absorbed by the horizontal
Support of 195.400 so as the
Pair is oversold we will be
Expecting a local rebound
And a correction on Monday
Buy!
Comment and subscribe to help us grow!
Check out other forecasts below too!
Disclosure: I am part of Trade Nation's Influencer program and receive a monthly fee for using their TradingView charts in my analysis.

GBPJPY: Pullback From Resistance 🇬🇧🇯🇵
I think that GBPJPY will pull back from a wide
intraday supply area.
As a confirmation, I see a bearish imbalance candle that
is formed after its test.
Goal - 198.51
❤️Please, support my work with like, thank you!❤️
I am part of Trade Nation's Influencer program and receive a monthly fee for using their TradingView charts in my analysis.

The recent uptrend has been decisively broken, with price actionThe currency pair showed sustained bullish momentum over the past weeks, forming higher highs and higher lows. However, recent price action broke below the ascending trendline and failed to retest previous highs, indicating waning bullish strength. The break of support suggests the uptrend has been invalidated, with increasing risk of a bearish reversal or short-term correction.

GBPJPYDate:
July 29,2025
Session:
London and New York Session
Pair:
GBPJPY
Bias:
Long
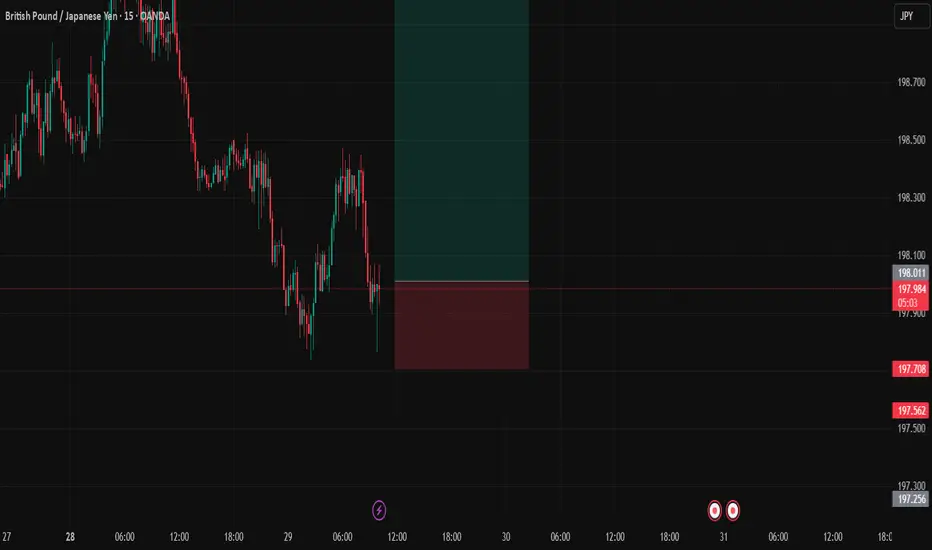
Yesterdays liquid untouched still lies. Expecting price to fill that area either by end of NY session or Asia.
Entry: 198.018
Stop Loss: 197.704
Target: 199.068
RR: 3.5
GBP-JPY Bearish Bias! Sell!
Hello,Traders!
GBP-JPY is going down
And the pair made a breakout
Of the key horizontal level
Of 195.500 so we are
Bearish biased and we
Will be expecting a
Further bearish move down
Sell!
Comment and subscribe to help us grow!
Check out other forecasts below too!
Disclosure: I am part of Trade Nation's Influencer program and receive a monthly fee for using their TradingView charts in my analysis.

GBPJPY is Holding above the SupportHello Traders
In This Chart GBPJPY HOURLY Forex Forecast By FOREX PLANET
today GBPJPY analysis 👆
🟢This Chart includes_ (GBPJPY market update)
🟢What is The Next Opportunity on GBPJPY Market
🟢how to Enter to the Valid Entry With Assurance Profit
This CHART is For Trader's that Want to Improve Their Technical Analysis Skills and Their Trading By Understanding How To Analyze The Market Using Multiple Timeframes and Understanding The Bigger Picture on the Charts

GBpJpY RETRACEMENT This is a possible retracement
Use a reasonable lot size
Risk only what you can afford
I wish you success

GBPJPY Is Very Bearish! Sell!
Please, check our technical outlook for GBPJPY.
Time Frame: 7h
Current Trend: Bearish
Sentiment: Overbought (based on 7-period RSI)
Forecast: Bearish
The market is trading around a solid horizontal structure 199.004.
The above observations make me that the market will inevitably achieve 198.074 level.
P.S
Please, note that an oversold/overbought condition can last for a long time, and therefore being oversold/overbought doesn't mean a price rally will come soon, or at all.
Disclosure: I am part of Trade Nation's Influencer program and receive a monthly fee for using their TradingView charts in my analysis.
Like and subscribe and comment my ideas if you enjoy them!

GBPJPY BUY SETUPGBPJPY is bullish on the daily timeframe and is currently retracing to continue buying. I want to see structural liquidity taken and tap my entry before continuing to the upside.

GJ SELL SETUP This GBP/JPY 30-minute chart shows a short trade setup based on Smart Money Concepts (SMC), liquidity sweep zones, and session highs/lows. Here's a breakdown of what’s happening:
1) Key Elements Identified in the Chart
Asian Session Range
Asian Highs (Yellow Zone at ~198.471–198.646): Marked as a key liquidity zone.
Asian Lows (Purple Line): Used for liquidity hunting and market structure context.
2) Market Structure
Prior to this setup, price had a bullish structure, forming higher highs.
Eventually, price broke structure to the downside, suggesting a shift to bearish momentum.
3)Liquidity Grabs
Price swept the Asian lows, tapping into sell-side liquidity.
The current move upward looks like a retracement into the Asian highs, likely aiming to grab buy-side liquidity.
4)Entry Zone
The entry is placed just around the Asian highs, targeting the idea that this area will act as a supply zone or breaker block.
Stop Loss (Red Box): Above the liquidity zone, where a breaker would be invalidated.
Take Profit (Green Box): Targeting the recent lows or continuation lower—likely the low around 197.438.
Risk-Reward Ratio
The R:R looks solid—about 2.5–3:1, suggesting a well-balanced trade.
Why This Is a Bearish Setup
Liquidity Sweep: Price ran below Asian lows, collected liquidity, and is now retracing.
Premium Zone: Current price is retracing into a premium zone (above equilibrium) where sellers are expected to re-enter.
Rejection Expected: The idea is that price will reject around 198.5–198.6 (where previous buy stops are likely stacked).
