GBPJPY short From what I'm seeing
GBPJPY is not done yet
As buyers have tried to push price higher but pressure from the sellers still keeping price from going any further.
The battle continues
Causing the market to range
Next week tell who wins
For I'm seeing sellers with the upper hand
My thoughts 💭 on GJ 🤔
JPYGBP trade ideas

GBPJPY Is Very Bearish! Sell!
Please, check our technical outlook for GBPJPY.
Time Frame: 45m
Current Trend: Bearish
Sentiment: Overbought (based on 7-period RSI)
Forecast: Bearish
The market is approaching a significant resistance area 198.994.
Due to the fact that we see a positive bearish reaction from the underlined area, I strongly believe that sellers will manage to push the price all the way down to 198.786 level.
P.S
Overbought describes a period of time where there has been a significant and consistent upward move in price over a period of time without much pullback.
Disclosure: I am part of Trade Nation's Influencer program and receive a monthly fee for using their TradingView charts in my analysis.
Like and subscribe and comment my ideas if you enjoy them!

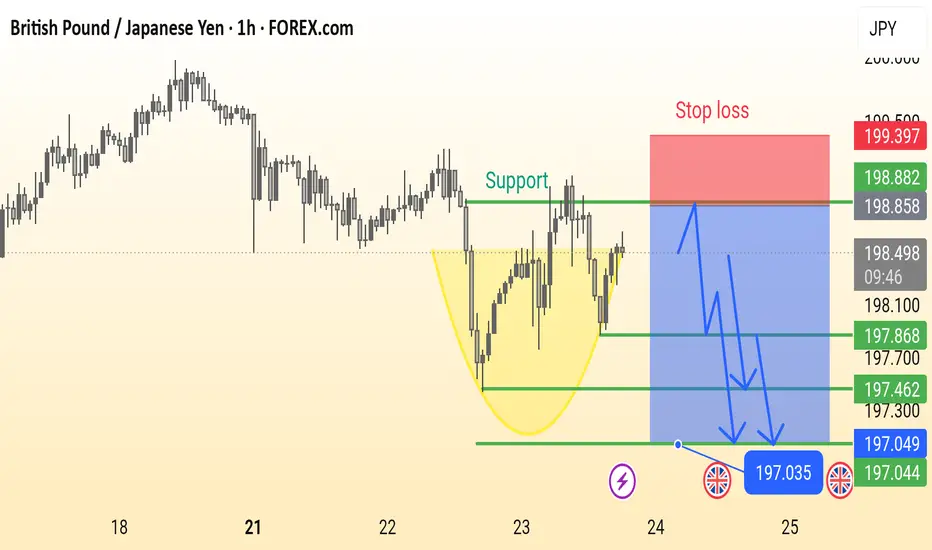
GBP/JPY Analysis is Ready This is a 1-hour chart of the GBP/JPY currency pair showing a potential bearish setup. Key elements include:
Support Zone: Around 198.000, previously tested multiple times.
Bearish Cup Pattern: Highlighted in yellow, suggesting a reversal.
Stop Loss: Marked above 199.397.
Sell Entry Zone: Near the support break at ~198.000.
Bearish Targets: 197.868 → 197.462 → 197.035 (with final support near 197.044).
Bearish Projection Arrows: Indicate expected price movement after breakdown.
This chart suggests a sell setup on breakdown, with well-defined risk and reward levels.
GBPJPY IdeaWe are waiting for our asset to reach our action zone, and based on the reaction, we’ll decide on our next moves.ALWAYS WAIT FOR A CONFIRMATION TO SEE IF THE PRICE VALIDATES THE ZONE.and you what is your vision of the EURUSD its interests me! i wait you in the commentary

GBPJPY is Holding above the SupportHello Traders
In This Chart GBPJPY HOURLY Forex Forecast By FOREX PLANET
today GBPJPY analysis 👆
🟢This Chart includes_ (GBPJPY market update)
🟢What is The Next Opportunity on GBPJPY Market
🟢how to Enter to the Valid Entry With Assurance Profit
This CHART is For Trader's that Want to Improve Their Technical Analysis Skills and Their Trading By Understanding How To Analyze The Market Using Multiple Timeframes and Understanding The Bigger Picture on the Charts

Guppy - Long TradeExpecting a bearish move down and then a strong reversal at the levels displayed!
Happy Trading!

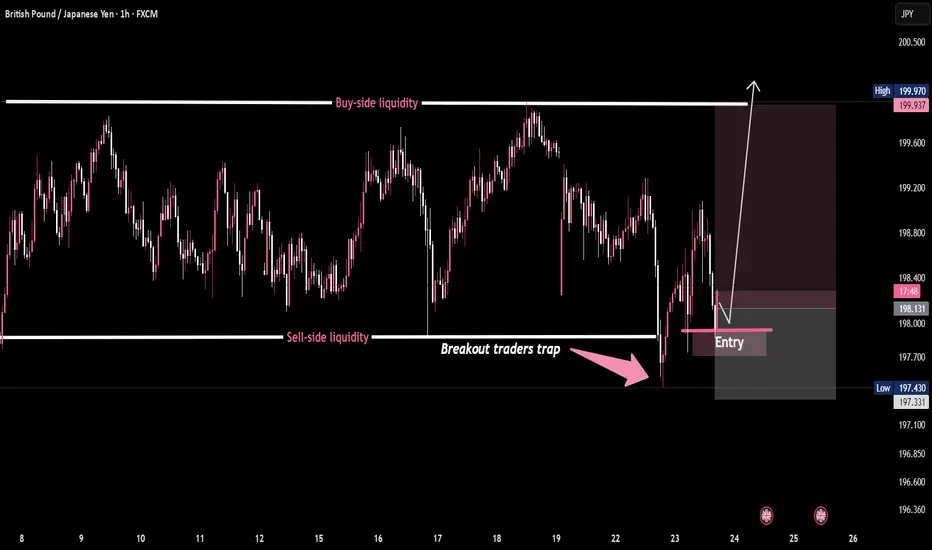
GBP/JPY - Classic Breakout Trap in PlayPrice nuked below range lows to sweep sell-side liquidity, trapping breakout sellers.
Smart money scooped it up. Entry reclaimed — now eyeing buy-side liquidity above 🎯
This is how the game is played:
1️⃣ Liquidity grab
2️⃣ Breakout trap
3️⃣ Reclaim & reverse
4️⃣ Target resting orders up top 🚀
📈 GBP/JPY – Classic Breakout Trap in Play 🧠💥
GBP/JPY SYMMETRICAL TRIANGLESYMMETRICAL TRIANGLE Completion: A potential breakout scenario for GBP/JPY involves the currency pair moving sharply out of a symmetrical triangle pattern. If the pair breaks above the upper trendline, it could signal a bullish move, with traders targeting higher resistance levels. Conversely, a break below the lower trendline may indicate a bearish trend, prompting a search for support levels.

GBPJPY 4HOUR TIME FRAME BUY ANALYSISOn the 4-hour chart, GBP/JPY is showing clear signs of a renewed bullish trend:
Higher-highs & higher-lows
Since mid-July, price has been carving out a staircase of successive peaks and troughs. The latest swing low around 197.30 held firm, and the subsequent rally cleared the June–July consolidation high near 198.40.
Breakout and retest
Price broke above a shallow descending trendline at ~197.65 late yesterday, then pulled back to retest that line as new support. Your entry at 197.902 sits just above that retest, giving a tight buffer to the stop.
Stop-loss placement
The SL at 197.275 undercuts the recent 4H swing low (197.30), so if that level fails it argues the bullish thesis is invalidated.

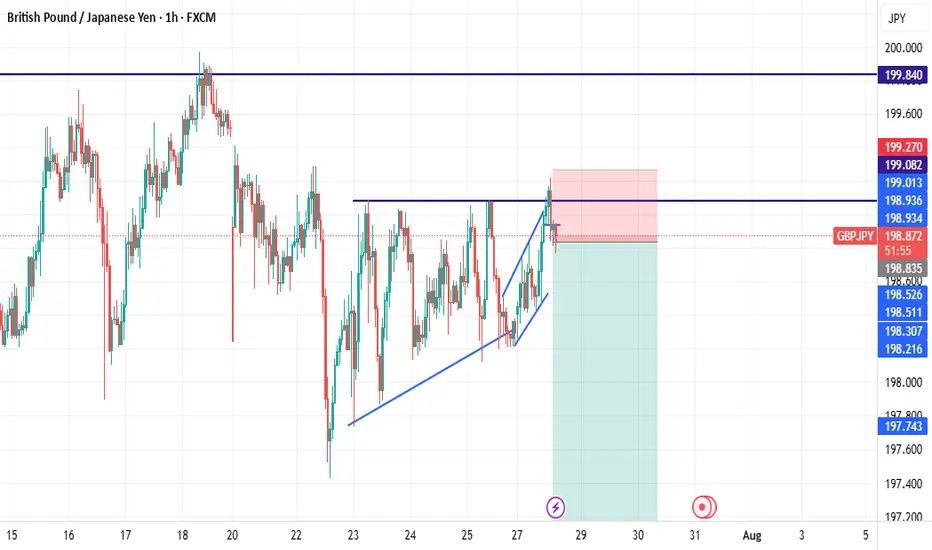
RECTANGLE CHANNELHello awesome traders! 👋
Hope you’ve managed to grab some solid pips from the markets this week. As we head into the weekend, I’m wrapping things up by dropping a few clean chart setups for you to review and reflect on.
Enjoy the weekend, recharge well — and I’ll see you sharp and ready next week for more structure-led opportunities.
📌 Pattern Breakdown
We’ve been tracking a developing rectangle channel between 197.94 (support) and 199.74 (resistance):
🔹 Price formed a clear 4-leg compression
🔹 CD leg bounced off lower support near 197.96
🔹 We’re now approaching the upper edge of the channel at 199.74
🔹 Compression structure suggests breakout potential is building
🚨 Breakout Setup in Focus
🔸 A breakout above 199.75 opens the door toward:
✅ Target 1 Zone:
• 1.5 extension = 200.76
✅ Target 2 Zone:
• 2.0 extension = 201.69
📌 Flip-side: A failed breakout and close back below 197.94 would shift structure toward:
🔻 Bearish Breakdown Targets:
• 1.5 = 197.02
• 2.0 = 196.09
• 2.618 = 194.94
We stay flexible — trade the breakout, not the anticipation.
🧠 Key Concepts in Play
✅ Rectangle consolidation
✅ Breakout-ready structure
✅ Defined upper/lower breakout levels
✅ Volume and reaction at edges = trigger
🗝 Final Thoughts
GBPJPY is boxed in tight — but momentum is clearly leaning bullish.
If we get that clean break above 199.75 with confirmation (volume, close, continuation), the 200.76+ range is firmly in sight. No breakout? No problem — structure has a plan either way.
“Boxes don’t trap the market — they build the tension. Breakouts reward the patient.”
GBPJPY Potential UpsidesHey Traders, in the coming week we are monitoring GBPJPY for a buying opportunity around 197.900 zone, GBPJPY is trading in an uptrend and currently is in a correction phase in which it is approaching the trend at 197.900 support and resistance area.
Trade safe, Joe.

gbpjpy
🔔 Trade Entry Recommendation:
Entry Zone: 198.70
This zone presents an ideal entry point for sell, as it lies just above a critical support area,
🛡 Stop Loss:
SL: 199.50
Placing the stop just below the support zone offers a favorable risk-reward ratio, while still allowing for normal price fluctuations.
🎯 Take Profit Targets:
TP1: 198.00
The first target is modest and offers a quick profit potential, ideal for short-term traders.
TP2: 197.50
This level represents a stronger resistance area, where partial profit-taking is recommended.
TP3: 197.000
A psychological round number and a historical price ceiling, which could act as a natural barrier.
Risk/Reward Analysis: This trade setup offers a solid risk-to-reward ratio. The entry and stop-loss are tightly aligned to minimize losses, while the profit targets provide ample upside potential.

GBPJPY Daily chart analyses
Advanced Price Analysis with Timeframes
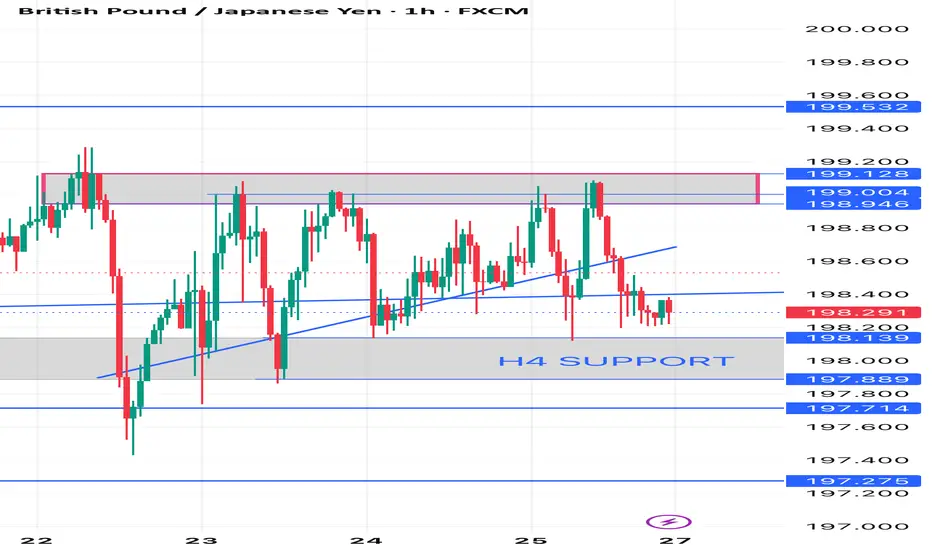
1. Key Observations from the Provided Data (H4 Chart)
Current Price197.800 testing the H4 SUPPORTlevel at 198.000
- Trend Downtrend (Lower Highs & Lower Lows).
- *Recent Structure
- Resistance ~199.600 (rejected multiple times).
- **Support -198.000 (critical level).
- If 198.000 breaks next support is 197.500–197.000
*a) Higher Timeframe (Daily/D1)
- If the **daily trend is bearish**, the H4 downtrend is likely to continue.
- If the **daily trend is bullish**, the H4 drop could be a retracement before a bounce.
- **Key Confirmation Needed**:
- Check if **198.000 aligns with a daily support level** (e.g., Fibonacci, moving averages).
**b) Lower Timeframe (H1/M15)
- **Breakdown Scenario**: If price stays below **198.000** with strong bearish candles, expect a drop to **197.500 → 197.000**.
- **Rebound Scenario**: If price holds **198.000** and forms a bullish reversal pattern (e.g., hammer, double bottom), a bounce to **198.600–199.000** is possible.
---
*3. Key Levels to Watch
| **Level** | **Importance** | **Scenario** |
|-----------------|-------------------------|--------------|
| **199.600** | Strong Resistance | Only break = Trend reversal |
| **198.600** | Minor Resistance | Re-test if bounce occurs |
| **198.000** | **H4 SUPPORT (Critical)** | Hold = Bounce / Break = Drop |
| **197.500** | Next Support | Target if 198 breaks |
| **197.000** | Psychological Support | Strong demand zone |
---
4. Trading Strategy Suggestions**
- **Bearish Bias (Down)**:
- Short if **198.000 breaks** with confirmation (e.g., closing below + high volume).
- Target: **197.500 → 197.000**.
- Stop Loss: **Above 198.300**.
- **Bullish Bias (Up)**:
- Long if **price bounces from 198.000** with a bullish pattern.
- Target: **198.600 → 199.000**.
- Stop Loss: **Below 197.800**.
---
5. Final Verdict**
- **Higher Probability**: **Downside** (unless 198.000 holds strongly).
- **Reversal Signal Needed**: Bullish engulfing, RSI divergence, or volume surge.
**Recommendation**: Wait for **confirmation at 198.000** before taking a trade.
potential here with a bearish moveThis is a continuation pattern to the downside that we are watching for a good short entry on. It could still push up to around 201.125 ish area, so no move yet, just on the radar.

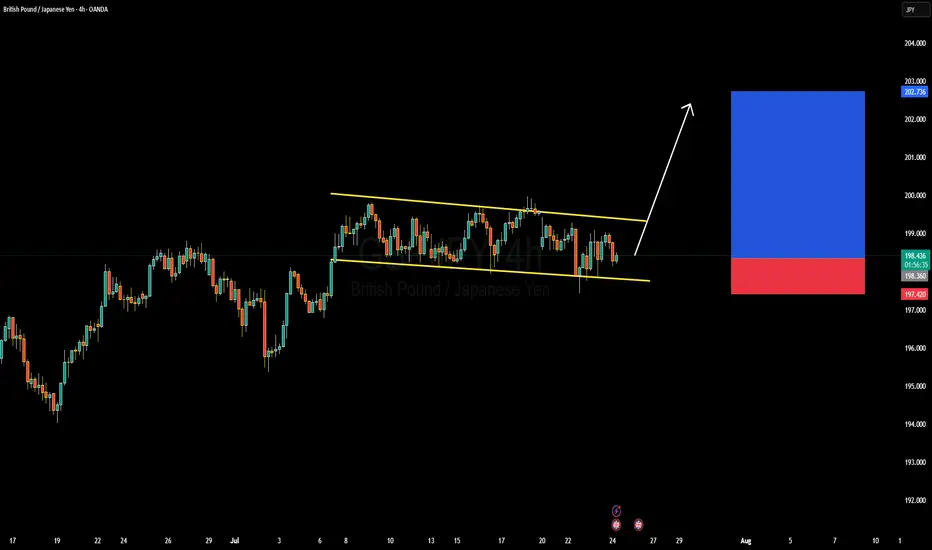
GBPJPY Forming Descending ChannelGBPJPY is currently trading within a well-defined descending channel on the 4H chart, showing signs of building pressure toward an upside breakout. The price has consistently respected both the upper and lower bounds of this channel, creating a controlled correction within a larger bullish trend. With the recent bounce off the lower channel boundary, the pair is now preparing for a potential bullish breakout, aiming for a target zone near 202.700 in the coming sessions.
From a fundamental perspective, the British pound is benefiting from hawkish commentary by the Bank of England, which continues to battle sticky inflation. The latest UK inflation data suggests that price pressures remain elevated, prompting market participants to anticipate further tightening or a prolonged hold in interest rates. On the other hand, the Japanese yen continues to weaken due to the Bank of Japan’s ultra-loose monetary policy, making GBPJPY attractive for long positions amid widening yield differentials.
Technically, the structure remains bullish in the broader context, and this descending channel looks more like a bullish flag—a continuation pattern. If bulls maintain momentum and break above the upper trendline near 199.50, we can expect a strong impulsive move toward the 202–203 zone. The risk remains well-defined below 197.40, which is the recent swing low, giving a healthy risk-to-reward setup for traders.
With strong technical structure and fundamental divergence favoring the British pound over the yen, GBPJPY presents a high-probability long opportunity. I'm looking for confirmation of a breakout on lower timeframes, and once triggered, I expect clean bullish follow-through. Stay ready for the breakout—it’s a textbook setup aligning with macro and technical confluence.
Understanding Market Structure: GBPJPY Trendline Support 📊 GBPJPY Technical Analysis — 15-Min Chart (As of July 24, 2025)
Trend Structure & Price Action
The chart shows a clear ascending trendline, connecting higher lows across the last sessions.
Multiple Break of Structure (BOS) points confirm bullish market behavior, with price consistently forming higher highs and higher lows.
The most recent BOS and price rejection from the lower boundary of the cloud band indicate bullish intent is still active.
Indicators Used
Custom Cloud Band (EMA Based 20, 1.5 settings):
Price is oscillating within and around the cloud band.
Recent candles are attempting to reclaim the upper band, suggesting building bullish momentum.
Volume Profile (VRVP) shows strong volume support around the 198.200–198.500 range, aligning with the trendline.
Support & Resistance
Support Zone: 198.200 (trendline confluence + volume shelf)
Immediate Resistance: 198.800–199.000
Major Resistance: 199.400 (next psychological level and prior high)
Forecast & Trade Idea (Educational Purpose)
If price continues to respect the ascending trendline and breaks above the recent local high (~198.750), we could see a bullish breakout toward 199.200+.
A bullish flag or small consolidation above the trendline before breakout is likely, as illustrated by the arrow.
Invalidation occurs if price breaks and closes below the trendline and 198.200, which may trigger a short-term correction.
✅ Conclusion
GBPJPY is currently in a bullish market structure with support from both trendline and volume profile. A clean breakout above 198.800 with volume confirmation could fuel continuation toward 199.200 and beyond. Risk management is crucial — watch for false breakouts or a shift in structure below the rising trendline.

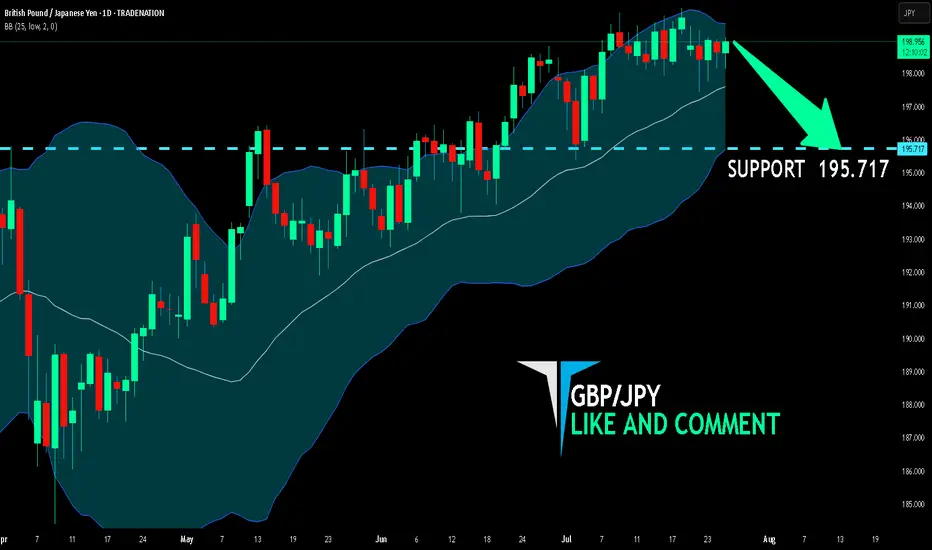
GBP/JPY BEARISH BIAS RIGHT NOW| SHORT
Hello, Friends!
GBP/JPY pair is trading in a local uptrend which we know by looking at the previous 1W candle which is green. On the 1D timeframe the pair is going up too. The pair is overbought because the price is close to the upper band of the BB indicator. So we are looking to sell the pair with the upper BB line acting as resistance. The next target is 195.717 area.
Disclosure: I am part of Trade Nation's Influencer program and receive a monthly fee for using their TradingView charts in my analysis.
✅LIKE AND COMMENT MY IDEAS✅
GBPJPY uptrend co0ntinuation support at 196.75Key Support: 196.75
This level marks the prior consolidation zone and serves as a critical pivot. A corrective pullback toward 196.75 followed by a bullish reversal would validate the uptrend, with upside targets at:
199.20 – Initial resistance and short-term target
199.70 – Minor resistance zone
200.40 – Longer-term breakout objective
However, a daily close below 196.75 would invalidate the bullish scenario, potentially triggering a deeper retracement toward:
195.80 – Near-term support
194.80 – Key downside level in a bearish reversal
Conclusion:
As long as 196.75 holds, the bias remains bullish, favoring continuation toward the 199–200 zone. A confirmed break below this support would shift momentum, opening the door for a broader corrective decline.
This communication is for informational purposes only and should not be viewed as any form of recommendation as to a particular course of action or as investment advice. It is not intended as an offer or solicitation for the purchase or sale of any financial instrument or as an official confirmation of any transaction. Opinions, estimates and assumptions expressed herein are made as of the date of this communication and are subject to change without notice. This communication has been prepared based upon information, including market prices, data and other information, believed to be reliable; however, Trade Nation does not warrant its completeness or accuracy. All market prices and market data contained in or attached to this communication are indicative and subject to change without notice.

GBPJPY LONGHello, as you can see on the GBPJPY chart, there is a very strong support zone that price has not broken. In fact, we can also identify a fake breakout below that level, which reinforces the strength of the support.
My first target (TP1) is set at the next strong resistance zone, which aligns with a previous support turned resistance. The second target (TP2) is the Order Block (OB) at the top, which also aligns with where my strategy predicts the price will move. This setup suggests a potential bullish move from the current levels.

GBPJPY Potential UpsidesHey Traders, in today's trading session we are monitoring GBPJPY for a buying opportunity around 197.700 zone, GBPJPY is trading in an uptrend and currently is in a correction phase in which it is approaching the trend at 197.700 support and resistance area.
Trade safe, Joe.

GBPJPY outlook: Potential Sell Setup FormingPrice action has recently broken out of a sustained uptrend and completed a retest of the former trendline support, now acting as resistance. This behavior suggests a potential bearish setup is developing.
📉 Entry Level: ~198.700
🛑 Stop Loss: 199.200
🎯 Take Profit Targets:
• TP1: 196.515
• TP2: 194.521
We’re now watching for confirmation to enter short, anticipating a move toward the stated profit targets should momentum continue to shift in favor of the bears.

GBPJPY 4HOUR TIME FRAME ANALYISOn the 4-hour chart, GBP/JPY has been tracing out a clear up-trend over the past several weeks, marked by a sequence of higher highs and higher lows. Your proposed long entry at 198.632 neatly coincides with two layers of support:
Trendline support: A rising trendline drawn off the last two significant swing lows intercepts right around 198.6, suggesting the pair is catching a bid as it back-tests that line.
