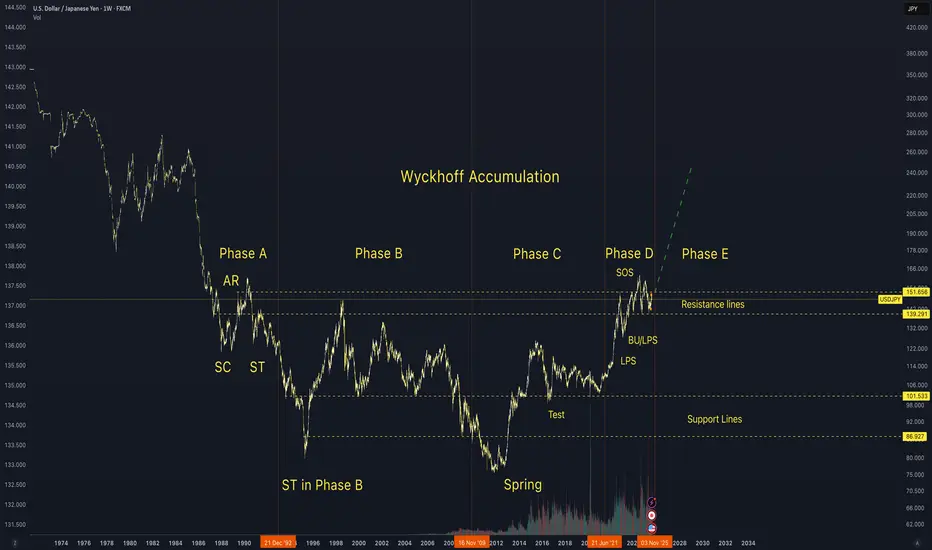
USD/JPY Wyckhoff Accumulation on weekly Chart Looks like a fairly textbook Wyckhoff accumulation on the USD/JPY Pair and looking ready to move up and to the right soon.
JPYUSD trade ideas
First possible for SELL After a long buy price need a correction movement and it can be a sell order

USDJPY HEADING UPThe daily time frame is showing potential bullish movement, seemingly forming structure after daily consolidation. Price bounced off of support and formed a higher low, a third retest of the bullish trend line will further validate this.

USD/JPY on the 1D timeframeBased on the chart I provided for USD/JPY on the 1D timeframe, here is the target analysis:
📉 Downtrend Analysis:
The chart is showing a descending channel, indicating a bearish trend.
Price has been respecting the upper and lower bounds of the channel.
Two target zones are marked with labels “TakeProfit”, suggesting projected bearish targets.
🎯 Identified Targets:
1. First Target Zone (TakeProfit):
📍 Around 152.00
This is the first expected support area where price may bounce or consolidate.
2. Second Target Zone (TakeProfit):
📍 Around 146.50 – 146.00
This level aligns with historical support and volume profile concentration.

USDJPY Weakening or a Correction to the Uptrend✏️ OANDA:USDJPY is approaching the old Break out support zone. The convergence zone of the 2 EMA lines. If there is a sweep to the support zone at the beginning of the week, it will be an opportunity to buy to continue the bullish wave structure. When this 146.200 zone is broken, the uptrend will be broken and we have to wait for new momentum to determine the next trend.
📉 Key Levels
Support: 146.200-143.200
Resistance: 150.800-154.500
Buy zone 146.300 (Support & Trendline)
Buy zone 143.200 Strong support zone
Target 154.500
Leave your comments on the idea. I am happy to read your views.

Lingrid | USDJPY Potential Channel Breakout. LongFX:USDJPY is retesting the breakout zone after reclaiming support from a prior swap area near 146.9. Price action has broken above a downward trendline and is forming a bullish retest structure. As long as USDJPY holds above 146.920 zone, the setup favors a continuation toward the resistance barrier. A breakout above the red descending trendline could accelerate upside momentum.
📉 Key Levels
Buy trigger: Break and hold above 147.500
Buy zone: 146.900 – 147.000
Target: 148.250
Invalidation: Break below 146.000
💡 Risks
Failure to break the descending red trendline may trigger renewed selling
Consolidation below resistance could signal buyer exhaustion
Break below 146.000 would invalidate bullish retest setup
If this idea resonates with you or you have your own opinion, traders, hit the comments. I’m excited to read your thoughts!

MORNING FORECASTING KEY LESSONSIn depth details on the things that you need to focus on when we are doing our morning forecasting as this is very important details to consider, do let me know in the comments sections below how do you find the video.

USD/JPY 4H –analysis Buy setupUSD/JPY (U.S. Dollar / Japanese Yen)
Timeframe: 4-Hour (4H)
Trend: Bullish Trendline Support – Price is respecting a strong ascending trendline.
Indicators: Ichimoku Cloud is visible; current price is above the cloud = bullish bias.
Current Price: Around 147.95.
---
✅ Buy Entry:
Entry Zone: Between 147.90 – 148.10
(As price is bouncing from the trendline support and Ichimoku cloud.)
🎯 Buy Targets:
1. Target 1: 148.99 (Previous structure resistance)
2. Target 2: 150.50 (Next resistance level)
3. Target 3 (Swing): 152.00+ (If momentum continues)
🛑 Stop Loss:
Below trendline + Ichimoku support = 146.80 (safe zone)
---
🔖 Chart Title Suggestion:
"USD/JPY 4H – Trendline Rebound with Bullish Momentum Targeting 150+"

USDJPY → False breakdown of upward trend supportFX:USDJPY is testing trend support as part of a correction triggered by news. The dollar has been recovering since the start of the session, giving the pair a chance to rise.
As part of a correction against the backdrop of sharp and unexpected Friday NFP data, the currency pair is forming a false breakdown of trend support and testing the 0.7f buy zone. The market is reacting to the retest of support. Momentum is forming. Focus on the local range of 147.6 - 147.9. If the bulls keep the price above this consolidation, the price may continue to rise
Resistance levels: 147.95, 149.02
Support levels: 157.55, 147.0
Focus on the trend and the indicated consolidation, which may move into the realization phase. If the bulls take the initiative, the pair will have a chance to rise to 149 - 150.8.
Best regards, R. Linda!

Key Observations 1. Rectangle + Double Top (“Top 2”) Formation (left side):
• Price ranged between ~147.5 and ~149.5.
• A double top inside the rectangle signaled resistance and potential reversal.
• Breakdown from the rectangle zone occurred, confirming bearish momentum.
2. Rising Wedge Pattern (right side, green zone):
• A bearish pattern forming higher highs and higher lows.
• The red arrow indicates an expected breakdown from the wedge.
3. Bearish Price Projection (blue arrows):
• The chart projects a sharp drop following the wedge breakdown.
• Multiple target levels are marked:
• First Target: ~147.0 zone.
• Final Target: Near 144.0, aligning with the measured move from previous breakdown.
4. Confluence of Bearish Signals:
• Rectangle breakdown + rising wedge.
• Bearish candle rejection near 149 resistance.
• Pattern-based technical targets drawn using past behavior.

USD/JPY Bearish Setup - Breakout from Ascending ChannelUSD/JPY Bearish Setup – Breakout from Ascending Channel
Price action on USD/JPY has broken down from an ascending channel, signaling potential bearish momentum ahead. The breakdown suggests a possible continuation toward lower support levels.
1st Support Level: 144.800 – 144.200
2nd Support Level: 143.000 – 142.400
Watch for price consolidation or retests at the 1st support level. A clean break below this zone could open the path toward the 2nd support level.
Key Notes:
Bearish volume increase post-breakout
Ichimoku cloud starting to thin, showing weakening bullish momentum
Structure favors selling rallies below the channel
📉 Bias: Bearish
💡 Plan: Wait for confirmation on lower timeframes before entering short positions

USDJPY descending only to fetch more buyers.The USDJPY bearish mode might be short-lived if it could show any reversal pattern on a shown orderblock!

USD/JPY) Bullish trend analysis Read The captionSMC Trading point update
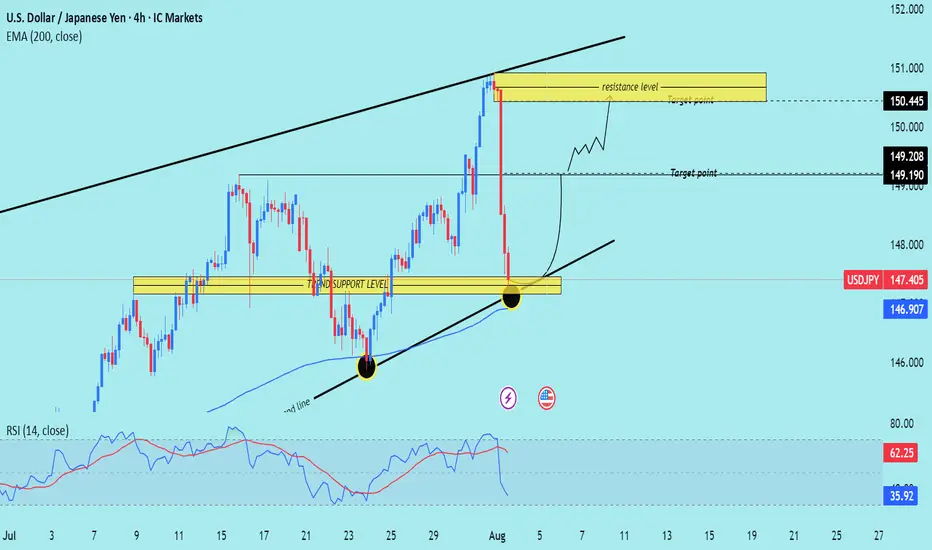
Technical analysis of USD/JPY on the 4-hour timeframe, using a combination of trendline support, key horizontal levels, and EMA 200 confluence to identify a potential bounce.
---
Technical Breakdown:
1. Market Structure:
USD/JPY experienced a sharp decline from the resistance zone near 150.445, but price is now testing a strong confluence support area:
Horizontal support zone
Rising trendline
200 EMA (146.907)
2. Support Confluence Zone:
Marked as "trend support level", this zone has historically acted as a springboard for bullish moves.
Recent price action shows a wick rejection at this zone, indicating buying pressure.
3. Resistance/Target Zones:
Target 1: 149.190 – 149.208
Target 2: 150.445 (major resistance zone)
4. EMA 200:
Price is reacting just above the 200 EMA, strengthening the bullish case for a bounce.
5. RSI (14):
RSI has dipped to 35.92, near oversold territory, suggesting the downside may be exhausted.
Prior bounce from similar RSI levels led to strong upward moves.
6. Projected Path:
The chart outlines a potential bullish recovery, targeting a climb back into the upper channel and retesting previous highs.
Mr SMC Trading point
---
Trade Idea Summary:
Bias: Bullish (Reversal from trendline + support zone)
Entry Zone: Current level near 147.40–146.90 (support confluence)
Targets:
TP1: 149.190
TP2: 150.445
Invalidation: Daily close below trendline and 200 EMA (~146.70 or lower)
Indicators: RSI supports a bounce; EMA and trendline confirm structure
Please support boost 🚀 this analysis)

USDJPY BULLISHTechnically:
Daily bullish
Bullish trendline support
200 EMA retest
Fib retracement
No bearish divergence

Buy usdjpyOur last buying idea already running 500+ pips in buying
Now more buy expected after a lil more retracment

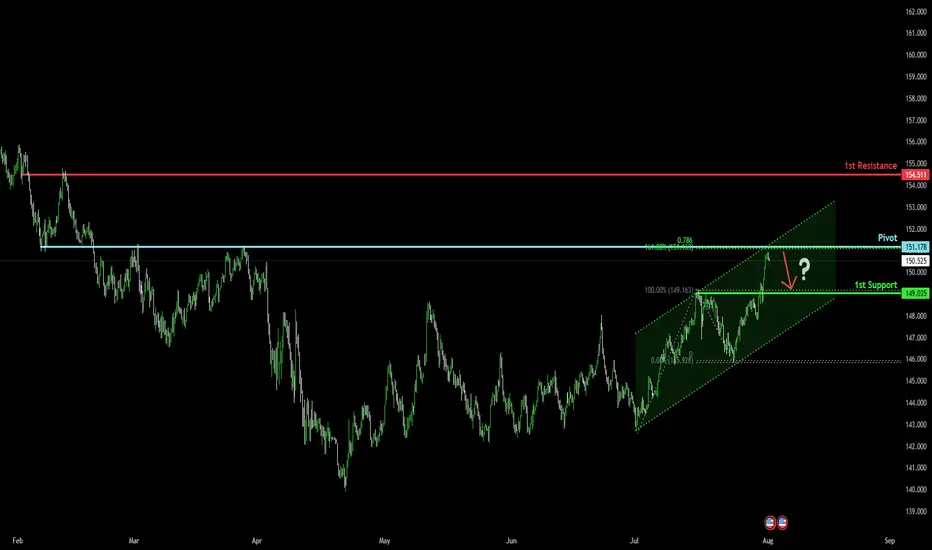
Bearish reversal off overlap resistance?USD/JPY is rising towards the pivot, which has been identified as an overlap resistance and could drop to the 1st support.
Pivot: 151.17
1st Support: 149.03
1st Resistance: 154.51
Risk Warning:
Trading Forex and CFDs carries a high level of risk to your capital and you should only trade with money you can afford to lose. Trading Forex and CFDs may not be suitable for all investors, so please ensure that you fully understand the risks involved and seek independent advice if necessary.
Disclaimer:
The above opinions given constitute general market commentary, and do not constitute the opinion or advice of IC Markets or any form of personal or investment advice.
Any opinions, news, research, analyses, prices, other information, or links to third-party sites contained on this website are provided on an "as-is" basis, are intended only to be informative, is not an advice nor a recommendation, nor research, or a record of our trading prices, or an offer of, or solicitation for a transaction in any financial instrument and thus should not be treated as such. The information provided does not involve any specific investment objectives, financial situation and needs of any specific person who may receive it. Please be aware, that past performance is not a reliable indicator of future performance and/or results. Past Performance or Forward-looking scenarios based upon the reasonable beliefs of the third-party provider are not a guarantee of future performance. Actual results may differ materially from those anticipated in forward-looking or past performance statements. IC Markets makes no representation or warranty and assumes no liability as to the accuracy or completeness of the information provided, nor any loss arising from any investment based on a recommendation, forecast or any information supplied by any third-party.
USDJPY Bullish Momentum Continues ? Hello traders, what do you think about USDJPY?
As of now, USDJPY is showing a slight upward movement after the recent correction. The price is trading around 147.59, not changing much since the beginning of the session.
The Japanese yen remains under pressure due to Japan’s slow recovery and ongoing economic challenges, giving USD an edge to capitalize on recent gains.
From a technical standpoint, USDJPY is moving in an ascending wedge pattern. After testing the trendline support near 147, the pair could be headed toward the psychological target of 150, or even higher towards the upper trendline boundary in the coming days.
Keep an eye on the price action near key resistance levels as the market continues to evaluate global economic factors, especially the upcoming US jobs data and Fed policy outlook.
What’s your take on USDJPY? Do you expect this pair to rise further? Let me know in the comments below!

USDJPY (Daily analysis) 06/08USDJPY (Daily analysis) 06/08 hi everyone hope you are having a good day. as always happy trading

USDJPY 15M BULLS BACK TO TAKE THIS TO THE MOON HAHAAs you can see we start having HL in MULTIPLE TIME FRAME
I took Buy here and let see what will give us

Lingrid | USDJPY Possible Strong Bullish RallyThe price perfectly fulfilled my previous idea . FX:USDJPY is trading within an upward channel after forming a higher low near the 147.50 zone, bouncing from the support trendline. Price action suggests a bullish structure continuation toward the 150.95 resistance, especially if the recent consolidation breaks higher. The overall formation aligns with a healthy correction phase before a potential push into the resistance area. Confirmation above 148.60 would likely accelerate the bullish move.
📌 Key Levels Buy zone: 147.50–147.25
Sell trigger: Below 147.00
Target: 150.95
Buy trigger: Break above 148.80
⚠️ Risks
Break below 147.50 may shift sentiment bearish
Strong resistance awaits near 150.00
Broader market volatility could invalidate pattern
If this idea resonates with you or you have your own opinion, traders, hit the comments. I’m excited to read your thoughts!

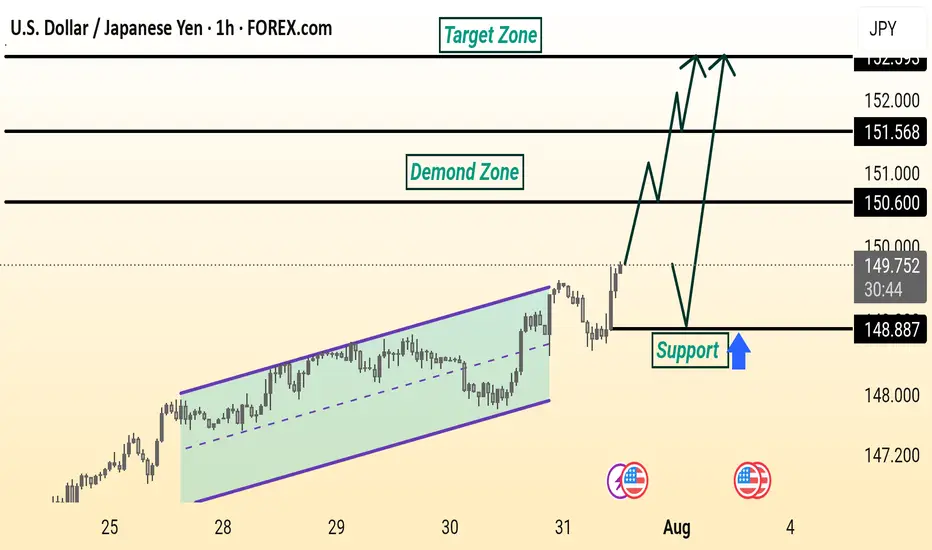
USD/JPY Analysis is Ready USD/JPY is showing a bullish setup. Price broke out of a rising channel and is expected to retest the 148.887 support level before moving higher toward the 150.600 and 151.568 resistance zones, targeting the 152.000 area. The demand zone adds strength to the potential upside.
USD/JPY Bearish Reversal SetupUSD/JPY 1H Analysis:
Price is showing signs of a potential reversal after hitting resistance near 147.757. The chart suggests a bearish move with multiple rejection zones, targeting the support area around 146.621. Key levels to watch include 147.343 and 147.038 as intermediate supports.
