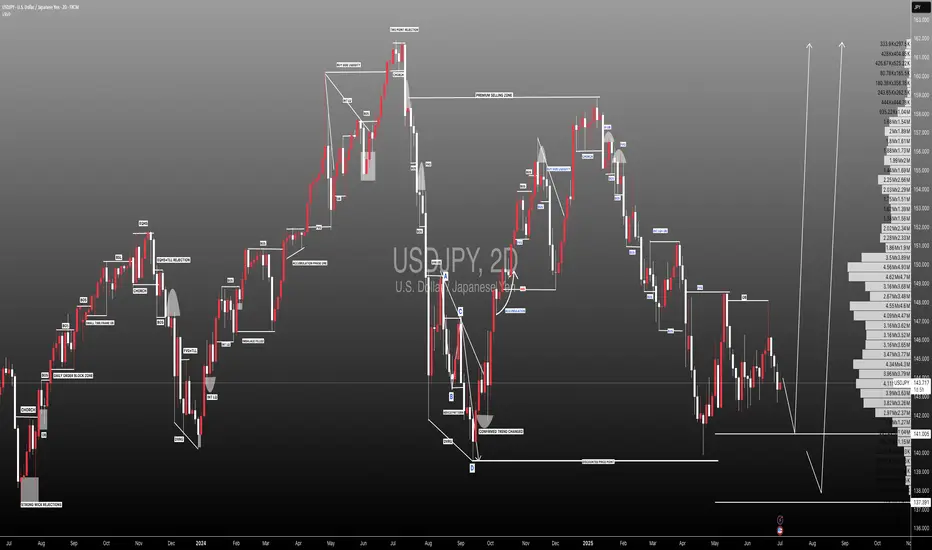
USDJPY M SIBI SELL SHORTUSDJPY M SIBI SELL SHORT
- Market in Monthly TF market is bearish
- Market in weekly TF is bullesh
- Market in Daily TF fully bullesh
- IN Monthly SIBI when market is present on our AOI then shift to LTF
find a Valid Market Structurer Shift with Valid OBI / LTF SIBI / BPR ,
- when market is in our OBI / LTF SIBI / BPR after Liquidity Swap then Entry in our AOI
with proper Tight SL with Open Target for a big Movement Catch . Partly Profit book our nearest HTF Liquidity .....
********************Enjoyyyyyyyyyyyyyyyyyyyyyyyyy
KGB Priyabrat Behera
ICT Trader & Advance Mapping SMC Trader
JPYUSD trade ideas

USDJPY - Bullish Structure in Play• Pair: USDJPY (UJ) • Bias: Bullish • HTF Overview (4H): • Clean external break to the upside confirms bull control heading into the new week. • Structure shift is undeniable — market bias is now favoring continued strength.
• MTF Refinement (30M): • Zoomed in to the 30M and identified internal liquidity (SSL) taken out. • Strong mitigation of internal OB followed. • Still in analysis mode — no trades taken yet.
• LTF Confirmation (5M): • Waiting on a refined CHoCH (marked by green lines at highs). • Once that prints and rules align, I’ll shift into trader mode for the execution.
• Entry Zone: • 30M OB mitigation + LTF (5M) CHoCH confirmation.
• Mindset Note: • Patience is the play. No guessing, no hesitation — just clean reads and precision strikes. • Analysis first, execution second. That’s the system.
Bless Trading!

Buy usdjpyStrong buy continues
Still not complete its bullish correction
It can retrace a few pips from market levels but long term buy expected

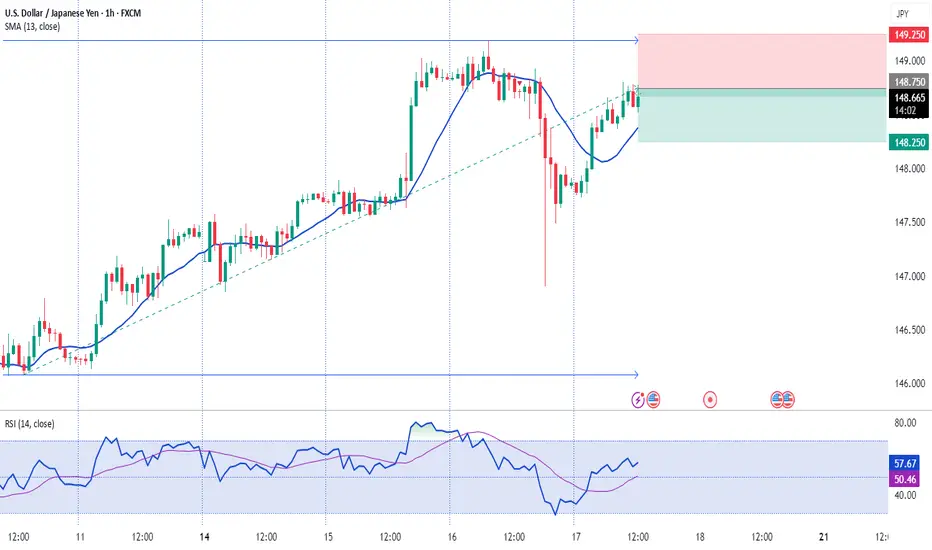
USD/JPY: The 150.00 Rejection SignalThe chart for USD/JPY looks like a simple one-way street going up. But underneath the surface, my quantitative models are in a state of conflict, and that's a high-clarity signal that something is about to change.
This isn't a signal to short right now. This is a signal to be patient and watch for a very specific setup that the "smart money" models are anticipating.
The Quant Conflict 🤖
My analysis involves several different mathematical models. Here's the situation:
One model, which is great at tracking trends, is still signaling BUY , following the obvious upward momentum.
However, two other, more complex models that analyze the relationships between economic data are now flashing a SELL signal. They are detecting underlying weakness that the price chart isn't showing yet.
When the simple trend model and the complex structural models disagree, it often means a major turning point is near. We are siding with the smarter models, but we need price action to confirm their warning.
The Game Plan 📊
We will use the 150.00 level as our "line in the sand." We are waiting for the market to fail at this level and then break down, which would confirm the bearish quant signal. This is our high-probability entry trigger.
Here is the exact setup we are waiting for:
📉 THE SETUP: A patient short position, waiting for confirmation of a breakdown.
👉 ENTRY: We enter only on a confirmed daily close below 148.00.
⛔️ STOP LOSS: Place the stop just above the psychological wall at 150.25.
🎯 TAKE PROFIT: Our primary target is the major support level at 145.00.
This is a setup where patience pays. We are letting the market do the hard work and show its hand before we commit. Let's watch this one closely.

USD/JPY - Pattern & SMA PerspectiveDear Friends in Trading,
How I see it,
Can demand/trend hold to jump over the 150.000 barrier?
1) Daily 200SMA @ 149.600 may cause serious pressure.
2) Will price hold above 1HR-200SMA in case of selling pressure?
3) The pattern suggests bullish continuation with limited downside.
I sincerely hope my point of view offers a valued insight.
Thank you for taking the time study my analysis.

USDJPY BUY CONTINUATIONBroke out of daily resistance zone, made retest of both zone and 50EMA. H1 has a minor resistance that needs a clear breakout before looking for buying signals.

USD_JPY STRONG UPTREND|LONG|
✅USD_JPY is in a strong
Long-term uptrend now
And the pair is accumulating
For the next leg up so we will
Be expecting a bullish continuation
On Monday!
LONG🚀
✅Like and subscribe to never miss a new idea!✅
Disclosure: I am part of Trade Nation's Influencer program and receive a monthly fee for using their TradingView charts in my analysis.

USDJPY – WEEKLY FORECAST Q3 | W30 | Y25📊 USDJPY – WEEKLY FORECAST
Q3 | W30 | Y25
Weekly Forecast 🔍📅
Here’s a short diagnosis of the current chart setup 🧠📈
Higher time frame order blocks have been identified — these are our patient points of interest 🎯🧭.
It’s crucial to wait for a confirmed break of structure 🧱✅ before forming a directional bias.
This keeps us disciplined and aligned with what price action is truly telling us.
📈 Risk Management Protocols
🔑 Core principles:
Max 1% risk per trade
Only execute at pre-identified levels
Use alerts, not emotion
Stick to your RR plan — minimum 1:2
🧠 You’re not paid for how many trades you take, you’re paid for how well you manage risk.
🧠 Weekly FRGNT Insight
"Trade what the market gives, not what your ego wants."
Stay mechanical. Stay focused. Let the probabilities work.
FRGNT FOREX ANALYSIS 📊
USD JPY shortthe long term trend is long but who know what trump has under his sleeve , so a lower high suggest there is chance of a mid term correction , or as its kind of more possible it can break above and make newer highs again ... if so consider buy opportunities for next week ...
Please note: This is for educational purposes only and not a trading signal. These ideas are shared purely for back testing and to exchange views. The goal is to inspire ideas and encourage discussion. If you notice anything wrong, feel free to share your thoughts. In the end, to learn is to share !

USDJPY ready to fire with 1:6 risk rewardWatch out USDJPY ready to fire on charts 15 min mass done pull back of Fib until .50 of previous swing I believe it should fall after touching 149.39. until then its good swing for upside.
1:6 risk reward is possible here
I'm not professional please do your own research before entering the trade.

USDJPY – Rejection Pressure Builds, Is a Reversal on the HorizonUSDJPY has been rejected for the third time at the diagonal resistance line, forming a potential lower-high pattern that suggests a reversal could be underway. The RSI is dropping from the overbought zone, clearly indicating weakening bullish momentum. If the price breaks below 146.900, a bearish trend may be confirmed, with a possible move toward the lower support area.
On the news front, U.S. Treasury yields have stalled after a strong rally, and jobless claims have ticked up slightly—dampening expectations for further Fed rate hikes. This puts pressure on the USD while favoring the safe-haven JPY.
Traders should closely monitor the price action around the 149.300 level. Continued rejection could offer a prime shorting opportunity!

USD-JPY Will Keep Growing! Buy!
Hello,Traders!
USD-JPY is trading in an
Uptrend along the rising
Support line and the pair
Already made a bullish
Rebound and is consolidating
In a local range so as we
Are bullish biased we will
Be expecting a further
Bullish move up
Buy!
Comment and subscribe to help us grow!
Check out other forecasts below too!
Disclosure: I am part of Trade Nation's Influencer program and receive a monthly fee for using their TradingView charts in my analysis.

USDJPY Potential UpsidesHey Traders, in today's trading session we are monitoring USDJPY for a buying opportunity around 148.500 zone, USDJPY for a buying opportunity around 148.500 zone, USDJPY is trading in an uptrend and currently is in a correction phase in which it is approaching the trend at 148.500 support and resistance area.
Trade safe, Joe.
#USDJPY: Price is currently accumulating ! Wait For DistributionAt present, the USDJPY currency pair appears to be in an accumulation phase, as evidenced by the absence of significant price movement throughout the current week. Several factors contribute to this trend.
Firstly, several significant economic events are scheduled for this week, particularly tomorrow and Friday. These developments hold substantial implications for the future trajectory of the USDJPY pair. Consequently, there exists a possibility that the price may experience a decline prior to initiating a bullish trend.
Secondly, there are two primary areas where the price could reverse its course. The extent to which the USD reacts to the economic data will serve as an indicator of the potential reversal zones.
It is imperative that you conduct your own analysis before making any financial decisions. This chart should be utilised solely for educational purposes and does not guarantee any specific outcome.
Regarding the stop loss, as this is a swing trade, it is advisable to employ a larger stop loss if the price reaches entry zones. The take profit level can be determined based on your entry type and analysis.
We wish you the best of luck in your trading endeavours and emphasise the importance of trading safely.
Kindly share this analysis with others through likes, comments, and social media platforms. If you have any questions or require further assistance, please do not hesitate to comment below. We are here to provide support.
Team Setupsfx_
❤️🚀
USD/JPY FORCAST🟦 Time Structure Analysis – USD/JPY | The 3-6-9 Temporal Cycle
📌 Price can lie. But time never does.
While many traders rely on price action or Elliott Wave counts, I take a different route — I trade time. Why?
Because time sets the rhythm, and the rhythm defines everything.
🔄 The 3-6-9 Time Cycle
Every complete market movement follows a hidden structure based on natural timing laws
In the current month, July 2 was the entry gate. That’s where I anchor the beginning of the new cycle.
⏳ Why Time Wins Over Price
Indicators lag
Price patterns repaint
But time never repaints.
Once the temporal cycle is locked in, it dictates future market rhythm.
You can identify where the market must move next — not by guessing the price level, but by counting time bars from a known pivot.
---
⚡ Strategy in Practice
In my system, I use:
✅ Cycle Lines starting from key reversal points
✅ Fixed monthly gates as temporal anchors
✅ Bar counting based on 3-6-9 geometry
✅ Fractal validation from higher timeframes
This gives me a predictive edge based on time pressure, not price patterns.
🎯 “The market doesn’t move because of buyers and sellers...
It moves because of time.”
Time is the structure. Price is just the effect.

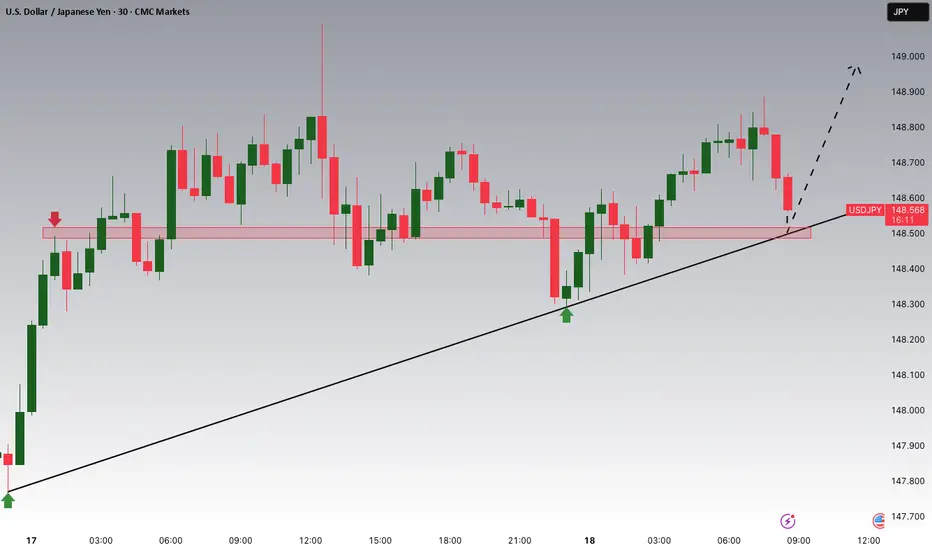
USDJPY🟢 USDJPY Trade Setup | BOS + Retest Strategy 🔥
Clear Break of Structure (BOS) followed by a clean retest into my Area of Interest (AOI).
High volume confirmation on rejection — I’m in this short trade with a 1:2.42 RR.
📉 Entry: 148.87
🛑 SL: 149.28
✅ TP: 148.10
This setup aligns with my mechanical strategy:
🔹 BOS
🔹 Retest
🔹 Liquidity sweep
🔹 Volume confirmation

USDJPY Symmetrical Triangle – Be Ready for Breakout or BreakdownUSDJPY is currently squeezed inside a well-formed symmetrical triangle, indicating a breakout is imminent. This consolidation pattern is nearing its apex, and price action is getting tighter. A sharp move in either direction could unfold soon. Here's how to prepare:
🟢 Bullish Breakout Setup:
Entry Trigger: 1H candle close above 148.70
Stop Loss: Below last higher low or triangle support (~148.15)
Targets:
TG1: 149.20
TG2: 149.60
Final TG: 149.95–150.00
Bias: Favors trend continuation (previous uptrend)
🔍 Confirmation: Strong breakout candle with momentum and/or volume.
🔴 Bearish Breakdown Setup:
Entry Trigger: 1H candle close below 148.15
Stop Loss: Above triangle resistance (~148.70)
Targets:
TG1: 147.60
TG2: 147.20
Final TG: 146.80
Bias: Reversal or failed trend continuation
🔍 Confirmation: Clean breakdown with bearish candle close + possible re-test rejection.
⚠️ Avoid premature entries inside the triangle. Wait for a confirmed breakout or breakdown with candle close and rejection follow-up.
🎯 Tip: Triangle breakouts often result in fast directional moves. Plan your lot size based on volatility and stick to your risk parameters. This is a high-probability setup — trade with discipline.
=================================================================
Disclosure: I am part of Trade Nation's Influencer program and receive a monthly fee for using their TradingView charts in my analysis.
=================================================================


Japan's core CPI cools as expectedThe Japanese yen is showing little movement on Friday. In the North American session, USD/JPY is trading at 148.69, up 0.06% on the day. On the data calendar, Japan's inflation rate eased in June. It's a light day in the US, highlighted by UoM consumer sentiment and inflation expectations.
Inflation in Japan fell in June as expected and the yen is showing little movement today. Headline CPI dropped to 3.3% y/y from 3.5% in May, matching the consensus. This was the lowest level since Nov. 2024, as prices for electricity and gasoline rose more slowly in June. FoodThe inflation numbers come just before an election for Japan's Upper House of Parliament on Sunday. The ruling coalition is in danger of losing its majority, and if that happens, it will likely impact yields and the yen next week.
The Bank of Japan meets next on July 31 and is expected to continue its wait-and-see approach and hold interest rates. The BoJ hiked rates in January but hopes for a series of rate increases were dashed after US President Trump promised and delivered tariffs on many US trading partners, including Japan.
Trade talks between the US and Japan have bogged down and Trump has threatened to hit Japan with 25% tariffs if an agreement isn't reached by Aug. 1. In this uncertain environment, the BoJ isn't likely to raise interest rates. prices were up 7.2%, the most since March, as rice prices soared 100%. Monthly, CPI eased to 0.1%, down from 0.3% in May. Core inflation, which excludes fresh food but includes energy, fell to 3.3% from 3.7%, in line with the consensus and the lowest pace since March.
USD/JPY is testing resistance at 148.66. Above, there is resistance at 1.4882
148.44 and 148.28 are the next support levels
USDJPY : More Upside Ahead?USDJPY : More Upside Ahead?
USDJPY remains firmly in a bullish trend, largely driven by renewed tariff concerns.
The yen weakened sharply after U.S. President Donald Trump reaffirmed plans to impose 25% tariffs on Japanese goods starting August 1st.
Since that announcement, USDJPY has rallied nearly 200 pips before encountering some profit-taking.
Despite the brief pause, the broader trend remains intact, and the pair appears poised for further gains.
Key upside targets to watch:
146.95
147.80
148.40
You may find more details in the chart!
Thank you and Good Luck!
PS: Please support with a like or comment if you find this analysis useful for your trading day
Disclosure: I am part of Trade Nation's Influencer program and receive a monthly fee for using their TradingView charts in my analysis.

USDJPY / U.S. Dollar – Japanese Yen (1D + 1H) – Multi-Timeframe USDJPY / U.S. Dollar – Japanese Yen (1D + 1H) – Multi-Timeframe Breakdown
Hello awesome traders! 👋
Closing the week with a full top-down look at USDJPY. We’ve got a macro bullish setup developing, but Friday gave us a well-structured intraday bearish opportunity worth studying. Let’s walk through the levels across the timeframes:
🧭 Macro Structure (Daily / 4H)
We start with a textbook Cypher formation on the macro frame, overlapping with a broad ABC bullish correction:
🔹 XA and BC legs are clean and proportionate
🔹 The D point completes just above the 78.6% XA zone
🔹 ABC structure suggests price may be completing a corrective leg within the larger bullish swing
🔍 Medium-Term Focus (4H): Zoom Into the ABC
As we zoom into the ABC leg:
🔸 A = 146.82
🔸 B = 149.08
🔸 C forms near 148.20 with shallow retracement
🔸 Completion shows signs of exhaustion
The ABC pullback aligns with prior resistance and fib confluence zones.
⏱ Intraday Breakdown (1H): Symmetry, Traps, and False Breakouts
This is where the intraday bearish case built up:
🔻 1. Symmetrical Triangle Breakdown
Price formed a clear compression triangle → broke lower → retested → failed again.
🔻 2. Double Top Structure + Cypher Trap
We had a false breakout above 149.08, followed by a rejection. This matches the Cypher reversal zone and classic trap behavior.
🎯 Friday Outlook
✅ Bias: Bearish
📍 Target 1: 38.2% = 148.21
📍 Target 2: 61.8–78.6% = 147.67 – 147.29
We're looking for price to rotate back into these fib support zones before macro structure takes back control. No bullish commitment unless we reclaim the 149.08 highs with strength.
🛡 Risk Management Note
This is short-term momentum inside a larger bullish frame. Treat intraday shorts with tight stops. Macro buyers may step in at the fib wall.
🗝 Final Thoughts
This is the perfect example of why multi-timeframe context matters.
Macro is prepping for a possible long-term continuation, but Friday’s lower timeframe offered an opportunistic short from structure, symmetry, and failed breakout traps.
“The market breathes in waves — one time frame exhales while the other prepares to inhale.”