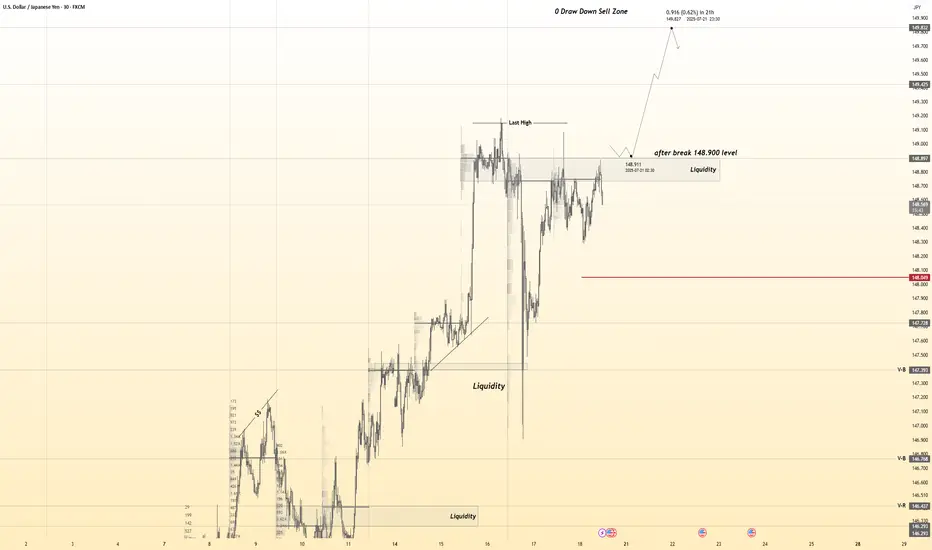
USDJPY 30Min Engaged ( Bullish After Breakout Entry Detected )————-
➕ Objective: Precision Volume Execution
Time Frame: 30-Minute Warfare
Entry Protocol: Only after volume-verified breakout
🩸 Bullish After Break : 148.900
➗ Hanzo Protocol: Volume-Tiered Entry Authority
➕ Zone Activated: Dynamic market pressure detected.
The level isn’t just price — it’s a memory of where they moved size.
Volume is rising beneath the surface — not noise, but preparation.
🔥 Tactical Note:
We wait for the energy signature — when volume betrays intention.
The trap gets set. The weak follow. We execute.
JPYUSD trade ideas
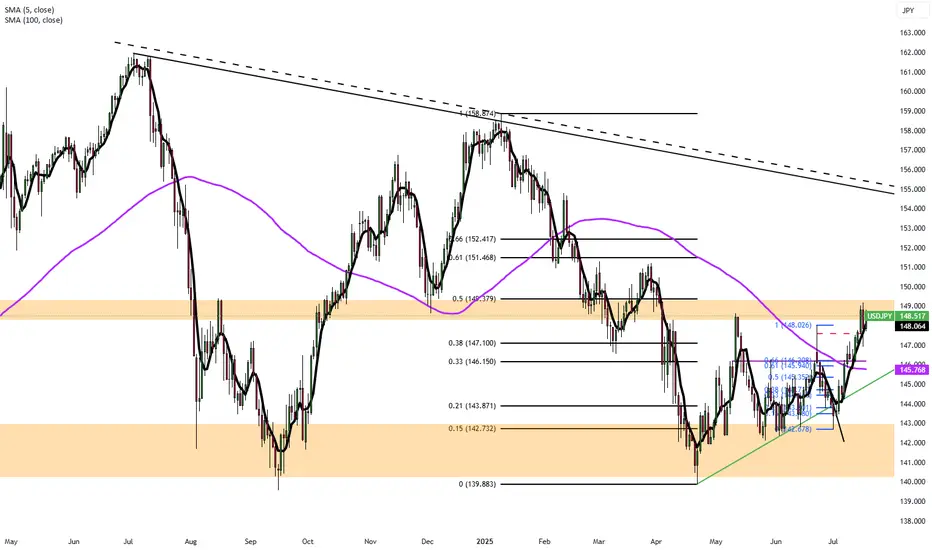
USDJPY Bullish breakout in Daily TimeFrame
USDJPY weekly and daily looks very bullish, it recently broke the resistance in daily and weekly candles.

USD JPY emergingyet can make a bearish flag its kind of emerging may happen since the candle yet its not closed its not validated wait for 1h close then open a trade...
Please note: This is for educational purposes only and not a trading signal. These ideas are shared purely for back testing and to exchange views. The goal is to inspire ideas and encourage discussion. If you notice anything wrong, feel free to share your thoughts. In the end, to learn is to share !

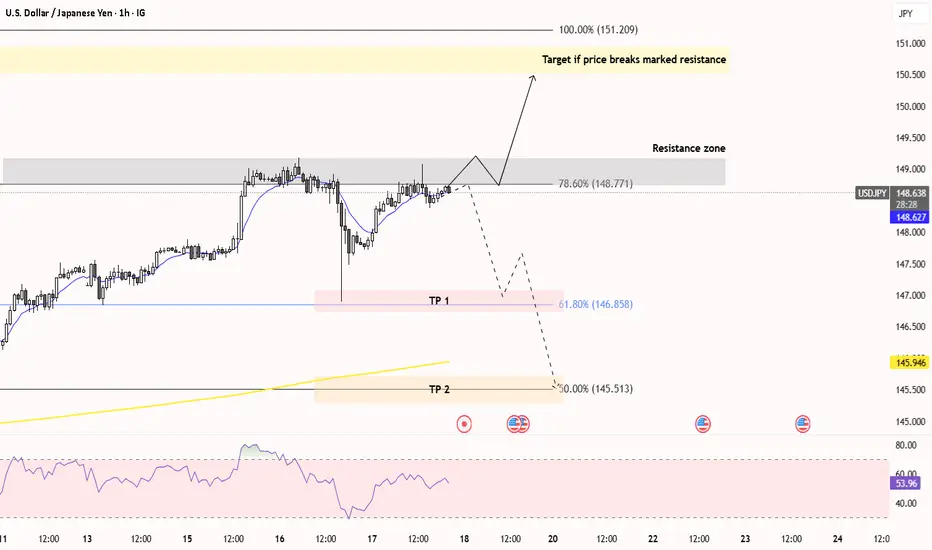
"USD/JPY Elliott Wave Short Setup – Targeting Key Support Zone"This chart shows a potential USD/JPY short trade setup based on Elliott Wave analysis. The price appears to have completed a 5-wave upward structure, reaching resistance near 148.75–149.19. A short position is suggested with:
Entry: Around 148.75
Stop Loss: Above 149.19
Target: 146.23–145.80 support zone
The trade aims to capture a corrective move following wave (5).

USDJPY INTRADY OPPORTUNITY Hello traders , here is the full multi time frame analysis for this pair, let me know in the comment section below if you have any questions , the entry will be taken only if all rules of the strategies will be satisfied. wait for more price action to develop before taking any position. I suggest you keep this pair on your watchlist and see if the rules of your strategy are satisfied.
🧠💡 Share your unique analysis, thoughts, and ideas in the comments section below. I'm excited to hear your perspective on this pair .
💭🔍 Don't hesitate to comment if you have any questions or queries regarding this analysis.

USD/JPY(20250718)Today's AnalysisMarket news:
① Kugler: It is appropriate to keep the interest rate policy stable for "a while".
② Daly: Whether to cut interest rates in July or September is not the most critical.
③ Bostic: It may be difficult to cut interest rates in the short term.
Technical analysis:
Today's buying and selling boundaries:
148.45
Support and resistance levels:
149.80
149.30
148.97
147.93
147.61
147.10
Trading strategy:
If the price breaks through 148.97, consider buying in, the first target price is 149.30
If the price breaks through 148.45, consider selling in, the first target price is 147.93

USD/JPY - Triangle Pattern (18.07.2025)The USD/JPY pair on the M30 timeframe presents a Potential Buying Opportunity due to a recent Formation of a Triangle Pattern. This suggests a shift in momentum towards the upside and a higher likelihood of further advances in the coming hours.
Possible Long Trade:
Entry: Consider Entering A Long Position around Trendline Of The Pattern.
Target Levels:
1st Resistance – 149.93
2nd Resistance – 150.65
🎁 Please hit the like button and
🎁 Leave a comment to support for My Post !
Your likes and comments are incredibly motivating and will encourage me to share more analysis with you.
Best Regards, KABHI_TA_TRADING
Thank you.
Disclosure: I am part of Trade Nation's Influencer program and receive a monthly fee for using their TradingView charts in my analysis.

USD/JPY is trending upward "USD/JPY is trending upward following a retracement on the 1-hour timeframe, driven by the release of weaker-than-expected CPI data from Japan earlier today." today

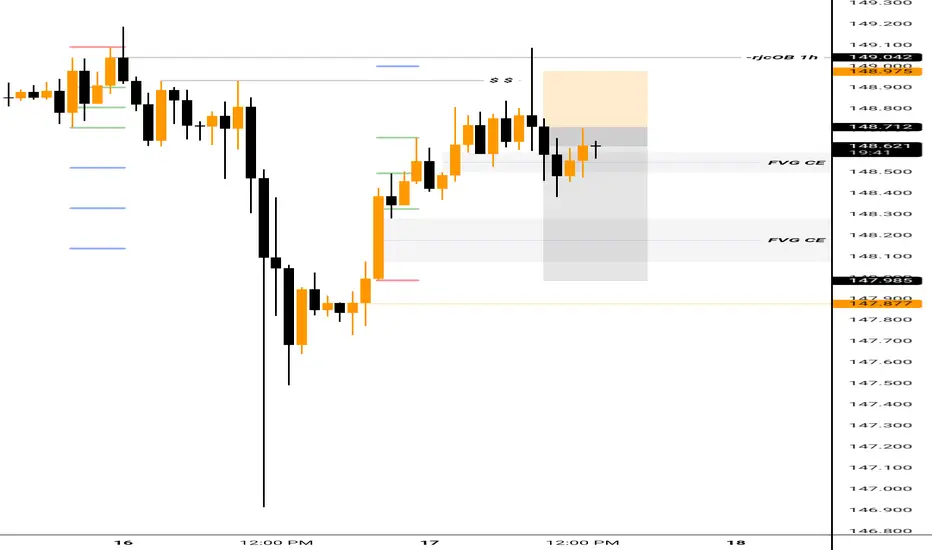
USDJPY – 4H Rally-Base-Drop in Daily SupplyUSDJPY – 4H Rally-Base-Drop in Daily Supply
Price has rallied into a high-quality 4H Rally-Base-Drop supply zone, which is nested cleanly inside a Daily supply zone—offering strong confluence for a short setup.
I'm anticipating a reaction from this institutional imbalance area, with price rejecting from the 148.260–148.735 zone. The target is down toward 145.228, creating a potential 1:3+ RRR.

USDJPY (daily analysis) 18/07here is another daily update on usdjpy, please note this is not financial advice. happy trading and have a great weekend

BUY USDJPYJPY weakness at Asia market open. USDJPY among other JPY pairs will seek supply. Target is at 148,820

USD/JPY: Battle at Resistance - Bull Run or Rejection?Alright Traders,
Here's my breakdown of USD/JPY's next moves:
The price has been repeatedly testing a strong resistance zone (those areas I've highlighted). It's really trying to push through, but this resistance is holding firm.
Here's the game plan:
If price successfully breaks above this resistance, we could see a strong bull run. My target for this move would be the 150 - 151 JPY zone (that yellow highlighted area).
However, if price gets rejected from this resistance again, going short could be a good idea. We might see it drop to test the 61.80% Fibonacci retracement level, or even further down to the 50% Fibonacci level.
I've put this analysis together using Fibonacci retracements, moving averages, trend lines, and price action.
Patience is key here. We need to wait for clear confirmation: either the resistance breaks, or price gets rejected and breaks the trendline support for a short entry.
Trade smart!
USDJPY H1 CONFIRM ANALYSISThe Japanese Yen selling remains unabated through the early European session on Thursday, which along with a goodish pickup in the US Dollar demand, lifts the USD/JPY pair to the 148.80 region in the last hour. Data released earlier today showed that Japan clocked a smaller-than-expected trade surplus in June.

Good setup to short USDJPYRecently the risk emotions caused by the White House and inflation worries it produced drives long term US Treasury yields rising, with 20-yr yield cross up to 5% once again.
Yet, you can see that the yield difference are still at a dropping trend. Moreover, the Fed is expected to cut 125 bps in the next 15 months according to the swap market.
Combined with the techincal levels, it's a good price to get into a short position of USDJPY. I don't know about you guys. I'm in

USDJPY SELL IDEAAfter yesterday's spiky move caused by d.trump
Market should correct some of those imbalance soon
Target at the ERL

SHORT ON USD/JPYNice CHOC (Change of Character) on USD/JPY
Followed by a retest to the supply area/zone with massive wick rejection.
I will be selling USD/JPY looking to catch over 200 pips to the next level of support/demand.

Short idea on JPYLikely a double top with momentum weakness.
Hoping the market to fall from here
Trade at your own Risks


USDJPY SELLJapanese Yen adds to intraday losses; USD/JPY climbs to 148.80 amid broad-based USD strength
The Japanese Yen selling remains unabated through the early European session on Thursday, which along with a goodish pickup in the US Dollar demand, lifts the USD/JPY pair to the 148.80 region in the last hour. Data released earlier today showed that Japan clocked a smaller-than-expected trade surplus in June.
From a technical perspective, the USD/JPY pair showed some resilience below the 100-hour Simple Moving Average (SMA) on Wednesday, and the subsequent move up favors bullish traders. Moreover, oscillators are holding comfortably in positive territory and are still away from being in the overbought zone, suggesting that the path of least resistance for spot prices is to the upside. Hence, some follow-through strength back towards the 149.00 mark, en route to the overnight swing high near the 149.15-149.20 region, looks like a distinct possibility. The upward trajectory could extend further towards reclaiming the 150.00 psychological mark for the first time since late March.
On the flip side, the 148.00 round figure now seems to protect the immediate downside ahead of the Asian session low, around the 147.70 region. The latter nears the 100-hour SMA, below which the USD/JPY pair could retest sub-147.00 levels. Some follow-through selling might shift the bias in favor of bearish trades and drag spot prices to the 146.60 intermediate support en route to the 146.20 area, the 146.00 mark, and the 100-day SMA support, currently pegged near the 145.80 region\
TP 1 147.931
TP 2 147.342
TP 3 146716
RESISTANCE 149.233
USDJPY SWING SHORTUSDJPY potential sell to fill downside liquidity following economic activities between the us and also the yen currency ,, target 140000

Advanced Order Types in ECN TradingAdvanced Order Types in ECN Trading
Electronic Communication Networks (ECN) have transformed the landscape of financial trading, offering direct market access and enhanced transparency. Central to ECN trading is the use of various order types, each tailored to specific strategies and risk management approaches. This article delves into advanced order types, providing traders with essential knowledge for navigating this dynamic trading environment.
Understanding ECN Trading
Electronic Communication Network (ECN) trading represents a pivotal development in financial markets, offering a pathway for traders to connect directly with each other without requiring intermediaries. This system functions through an electronic network that efficiently matches buy and sell trades, contributing to greater transparency and tighter spreads in the market.
In an ECN environment, traders can see the best available bid and ask prices, along with the market depth, which includes potential entries from various market participants. This visibility into the market's order book enables more informed decision-making as traders gain insights into potential market movements and liquidity.
A key advantage of ECNs is the anonymity they provide, enabling traders to execute transactions without exposing their strategy. This feature is particularly effective for large-volume traders who wish to avoid market impact.
ECN brokers, tend to offer lower costs compared to traditional market makers, as they typically charge a fixed commission per transaction rather than relying on the bid-ask spread. Such a cost structure can be advantageous for active traders and those employing high-frequency trading strategies.
Basic Market Order Types Explained
Forex and CFD trading involves several different order types, each serving unique strategies and goals. Among the most fundamental are market, limit and stop orders:
- Market: This type allows traders to buy or sell an asset at the current price. It's designed to offer immediate execution, making it ideal for traders who prioritise speed over control. They’re used when certainty of execution is more important than the execution price.
- Limit: Limit orders enable traders to specify the level at which they wish to buy or sell. A buy limit is set below the current price, while a sell limit is above. This type is used when traders seek to control the rate, accepting the risk of the entry not being filled if the market doesn’t reach their specified level.
- Stop: Stop orders act as a trigger for a trade. When the asset reaches the specified stop level, the stop becomes a market entry and executes a trade at the current price. It's a simple yet effective way to enter or exit the market at a predetermined point.
Advanced ECN Order Types
Advanced order types offer traders nuanced control over their transactions, catering to specific strategies and risk management needs. Here, we delve into three types: stop losses, trailing stops, and icebergs.
- Stop Loss: These are designed to limit a trader's loss on a position. A stop-loss order automatically sells (or buys, in the case of a short position) when the asset hits a predefined level. This tool is crucial in risk management, as it helps traders cap potential losses without the need to constantly monitor the charts.
- Trailing Stop: Trailing stop orders provide a dynamic way to manage risk. Instead of setting a fixed exit level like in a stop loss, a trailing stop moves with the current price at a set distance, potentially allowing traders to secure returns automatically as the market moves favourably, and adjusts to potentially protect against adverse moves.
- Iceberg: Named for the way only a small part of the total transaction is visible to the market, icebergs are used to buy or sell large quantities with small transactions. They prevent significant market impact, which could occur from a large trade and provide more discreet execution.
Stop Limit Orders Explained
In ECN trading, stop limit orders are an intricate yet powerful tool, blending the characteristics of stop and limit orders. A stop limit order type involves two prices: the stop price, which triggers the trade, and the limit price, at which the entry will be executed. It offers more control than a basic limit or stop order by specifying the exact range within which a trade should occur.
In a stop-limit buy order explained example, the stop price is set above the current price, and the limit price is set higher than the stop price. Once the stop level is reached, it becomes an order to buy at the limit price or better. It ensures that the trader does not pay more than a predetermined price.
The difference between a limit order and a stop order lies in their execution. A limit is executed at a specified value or better, but it doesn't guarantee execution. A stop, on the other hand, triggers at a specified price and then becomes a market entry executed at the current price. Stop limits merge these features, offering a targeted range for execution and combining the certainty of a stop order with the control of a limit order.
Conditional Orders
In ECN trading, conditional orders are sophisticated tools enabling traders to implement complex strategies. Here are the key types:
- One-Cancels-the-Other (OCO): An OCO links two orders; when one executes, the other is automatically cancelled. It's useful when setting up simultaneous profit and loss targets.
- One-Triggers-Another (OTA): An OTA activates a secondary instruction only after the primary order executes. They’re ideal for those planning successive actions based on initial trade execution.
- Ladder: This involves setting multiple orders at varying levels. As the market hits each level, a new order activates, allowing for gradual execution. They’re effective in managing entry and exit strategies in volatile assets.
- Order By Date (OBD): OBDs are time-based, executing on a specified date. It’s particularly useful for those looking to align their trades with specific events or timelines.
The Bottom Line
Mastering advanced order types in ECN trading may equip traders with the tools necessary for more effective strategy execution and risk management.
This article represents the opinion of the Companies operating under the FXOpen brand only. It is not to be construed as an offer, solicitation, or recommendation with respect to products and services provided by the Companies operating under the FXOpen brand, nor is it to be considered financial advice.
Yen Falls on Weak Trade DataThe Japanese yen weakened to around 148 per dollar on Thursday after disappointing trade data fueled concerns of a technical recession. June’s trade surplus came in at JPY 153.1 billion, well below the JPY 353.9 billion forecast and JPY 221.3 billion from a year earlier. Exports dropped 0.5% YoY, the second straight monthly decline, mainly due to the fallout from U.S. tariffs.
These signs have heightened fears of another quarterly contraction for Japan.
Resistance is at 147.75, with major support at 146.15.