USDJPY H1 Support & Resistance Levels🚀 Here are some key zones I've identified on the 15m timeframe.
These zones are based on real-time data analysis performed by a custom software I personally developed.
The tool is designed to scan the market continuously and highlight potential areas of interest based on price action behavior and volume dynamics.
Your feedback is welcome!
JPYUSD trade ideas

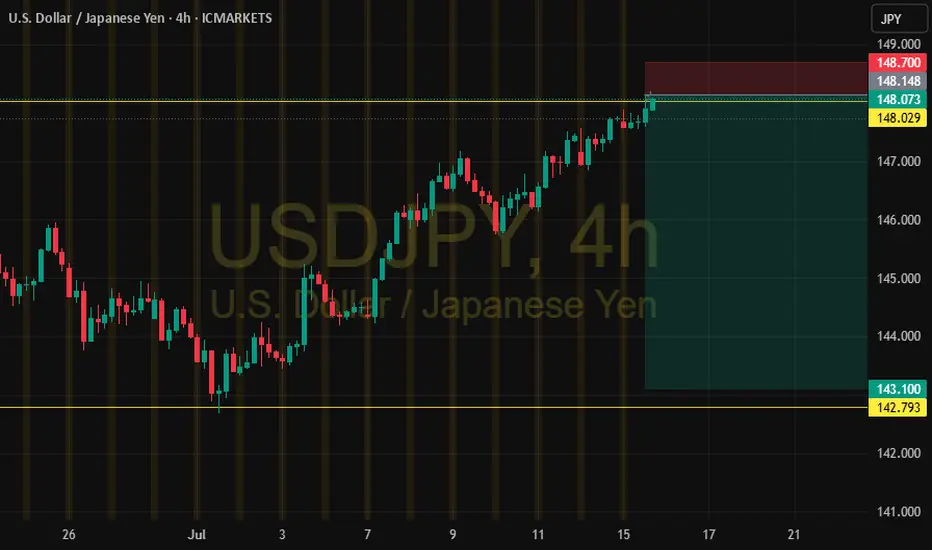
Sweet sales✅ Closed below 148.700 = confirmation of bearish pressure.
📉 Structure shows that bulls are losing strength and sellers are stepping in.

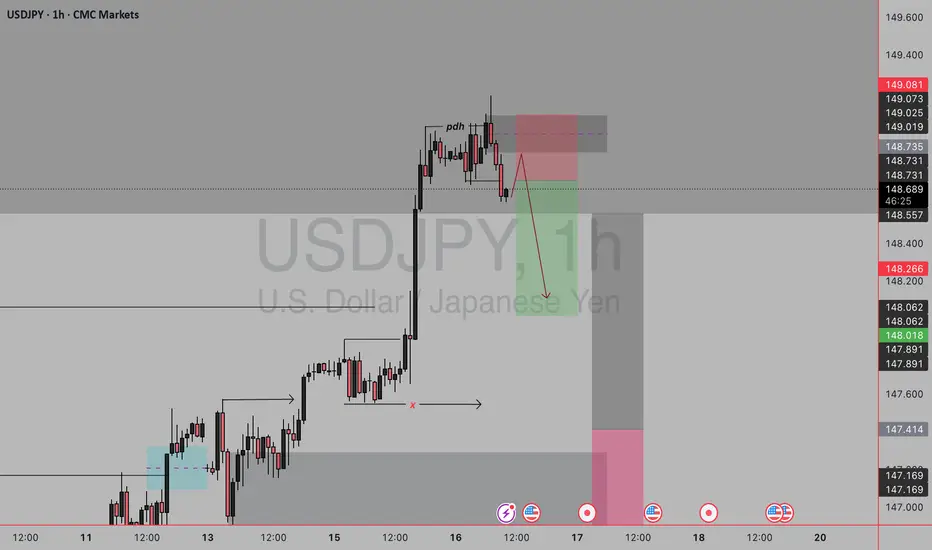
usdjpy sell setupPrevious day high swept by day high looking to buy at discount areas near yesterday low so sell setup with stops at yesterday high which has already been swept .In lower tf as seen we are filling imbalance to continue higher while dxy also retrace previous resistance as support we would look to short to the area
USD/JPY:Bulls Eye Break Above 149.50, Yen Remains Under Pressure
The Japanese Yen slipped to its lowest level since April during the Asian session on Wednesday, weighed down by fading expectations of a near term rate hike from the Bank of Japan (BoJ). The market reaction reflects growing concerns over the potential economic fallout from recently imposed higher US tariffs, which has dampened hawkish bets on the BoJ and contributed to the Yen's underperformance in July.
On the flip side, the US Dollar remains well-supported, with the USD Index (DXY) surging to its highest level since June 23 following Tuesday's hotter-than-expected US CPI data. The inflation print reinforced the view that the Federal Reserve may delay rate cuts, thereby underpinning demand for the Greenback.
Technical Outlook
From a technical standpoint, USD/JPY’s breakout above the June high at 148.50 and a subsequent move beyond the May swing high around 148.65 has triggered fresh bullish momentum. This bullish bias remains intact as long as the pair holds above the 148.50 support zone.
Immediate Support: 148.50, followed by 148.00
Key Demand Zone: 147.55 horizontal level that could act as a pivot. Break below here might open the door to a deeper pullback toward the 146.30 and 146.25 area.
Immediate Resistance: 149.00, followed by 149.35 and 149.40 zone.
Key Hurdle: 150.00 is a psychologically significant level where bulls may encounter strong resistance. A sustained move and daily close above 149.50 could act as a catalyst for further gains, possibly setting the stage for a test of 150.00 in the near term.
The forecasts provided herein are intended for informational purposes only and should not be construed as guarantees of future performance. This is an example only to enhance a consumer's understanding of the strategy being described above and is not to be taken as Blueberry Markets providing personal advice.

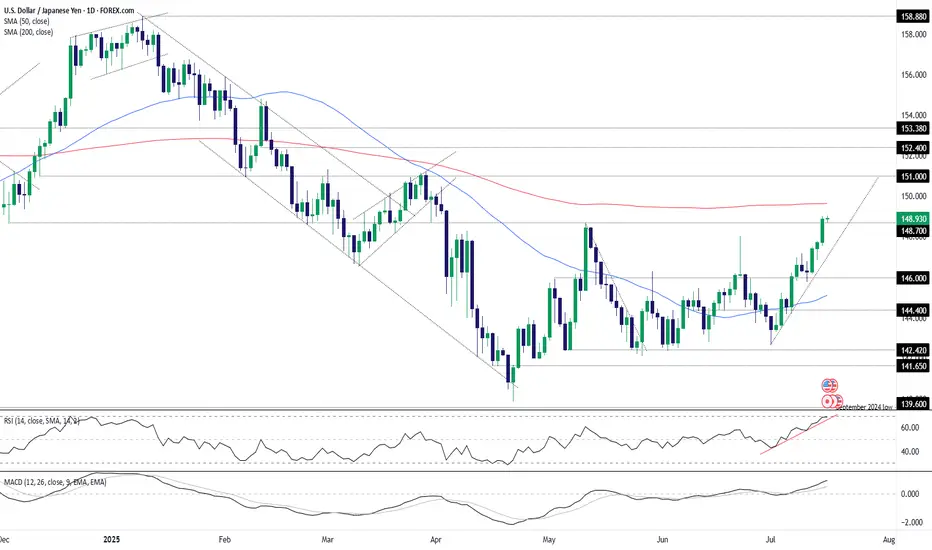
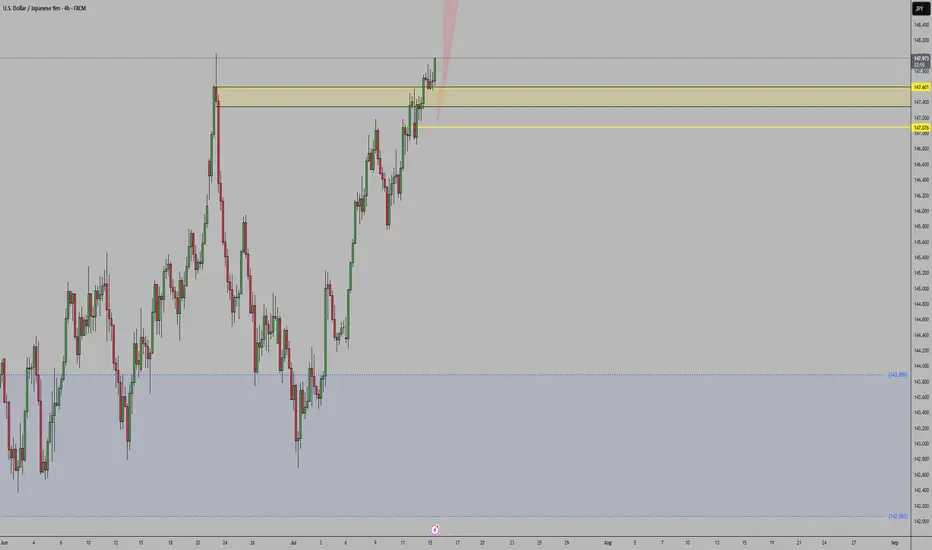
USD/JPY 4-Hour Forex Chart4-hour performance of the U.S. Dollar (USD) against the Japanese Yen (JPY) from late June to mid-July 2025, sourced from FOREX.com. The current exchange rate is 147.436, with a 1.178 (+0.81%) increase. Key levels include a sell price of 147.393 and a buy price of 147.479. The chart shows a recent upward trend with a resistance zone highlighted between 147.436 and 148.092, and support around 146.598. Candlestick patterns indicate volatility, with notable price movements around early July.

Fundamental Market Analysis for July 16, 2025 USDJPYEvent to Watch Today:
15:30 EET. USD – Producer Price Index
USDJPY:
USD/JPY has stabilized around 148.900, maintaining upside potential due to:
Interest Rates: The Fed keeps yields elevated (10-year bonds at 4.46%), while the Bank of Japan maintains an ultra-loose policy, keeping real yields negative.
Political Uncertainty: Upcoming elections in Japan and possible fiscal tightening reduce the yen’s appeal.
Dollar Demand: Trade frictions and geopolitical risks drive safe-haven flows into the dollar.
A break above 149.000 could open the path to 149.500. Support at 148.600 remains a critical barrier for the bullish scenario.
Trade Recommendation: BUY 149.000, SL 148.700, TP 149.900

USDJPY (Daily Analysis) 16/07please see my daily review of usdjpy. hope all the information has been outlined. please note this is not financial advice. happy trading

USD/JPY: 148.70 cleared as yields and momentum alignAided by the latest leg higher for U.S. Treasury yields following the June U.S. inflation report, USD/JPY closed at the highest level since April on Tuesday, taking out the important 148.70 level in the process. If the pair manages to consolidate the break on Wednesday ahead of separate U.S. PPI data for June, the level may revert to offering support, providing a platform for new long positions to be established with a stop below for protection.
The 200-day moving average is the first major hurdle for bulls to overcome, sitting today at 149.63. If it were to be taken out, it would only add to the bullish price action seen recently. Above, 150 will naturally receive some attention given it’s a major big figure, although there’s little visible resistance until 151.00.
If USD/JPY were to reverse back below 148.70 and close there, it would provide bulls with some food for thought, opening the door for a potential retest of the uptrend the pair has been sitting in since the start of July. However, the message from momentum indicators like RSI (14) and MACD is firmly bullish. With the 50-day moving average also starting to curl higher, near-term price momentum is definitely with the bulls, favouring buying dips in this environment.
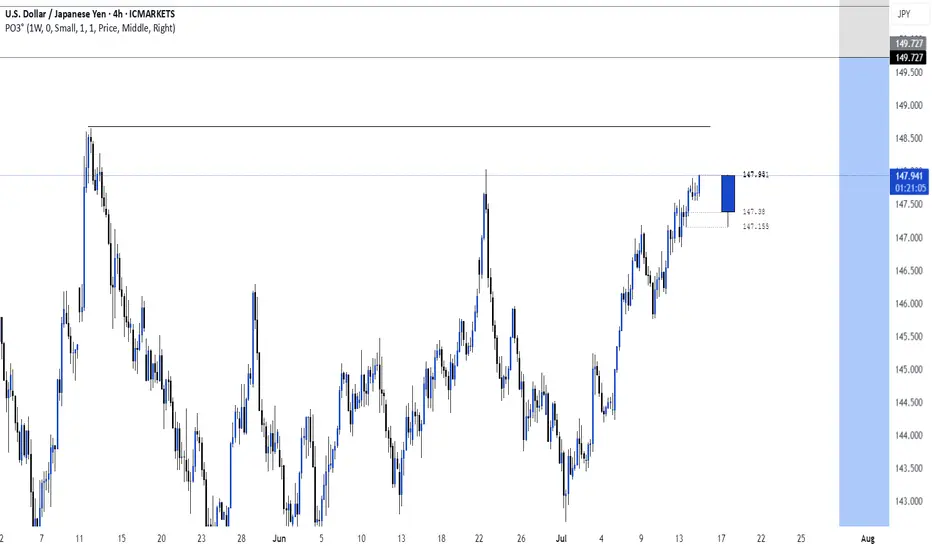
Pullback ahead The USDJPY pair has broken above previous month's high aggressively, a bearish retracement could possibly step in at this level, as price looks like it's resisting to keep pushing higher.
Support levels for profit taking: 147.777;
147.09; 146.2
USDJPY Wave Analysis – 15 July 2025
- USDJPY broke the resistance area
- Likely to rise to resistance level 151.30
USDJPY currency pair recently broke the resistance area located at the intersection of the resistance level 148.00 and the two resistance trendlines from January and March.
The breakout of this resistance area should strengthen the bullish pressure on his currency pair.
Given the continuation of the widespread yen sales seen recently across FX markets, USDJPY currency pair index can be expected to rise to the next resistance level 151.30 (monthly high from March).

USDJPY shortToday seems to be a risky day. I'm not leaning toward this idea, but it's the first thing I noticed. Also, the channel is very steep, so it could be a fake channel.

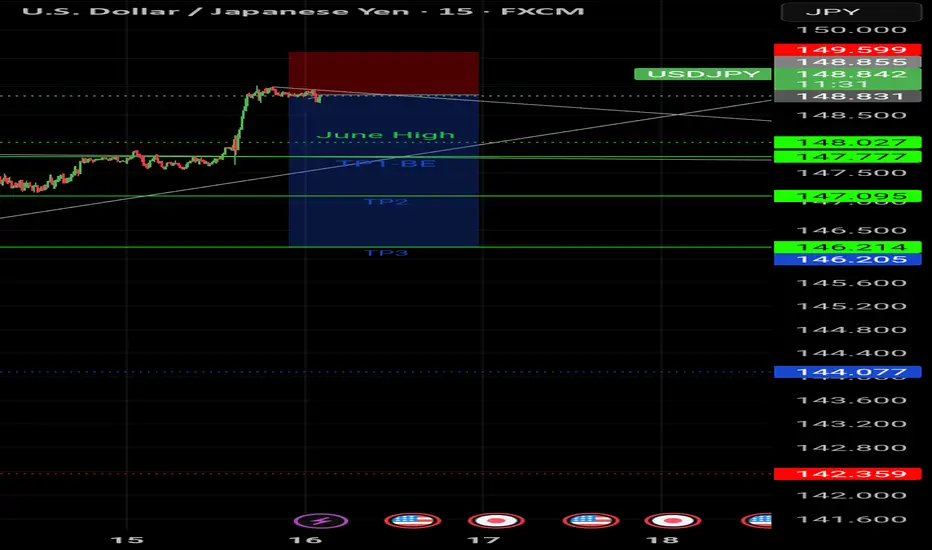
Bearish reversal?USD/JPY is reacting off the resistance level which is a pullback resistance that lines up with the 78.6% Fibonacci projection and slightly below the 127.2% Fibonacci extension.
Entry: 148.99
Why we like it:
There is a pullback resistance that lines up with the 78.6% Fibonacci projection and also slightly below the 127.2% Fibonacci extension.
Stop loss: 151.20
Why we like it:
There is an overlap resistance that aligns with the 161.8% Fibonacci extension.
Take profit: 147.08
Why we like it:
There is an overlap support level.
Enjoying your TradingView experience? Review us!
Please be advised that the information presented on TradingView is provided to Vantage (‘Vantage Global Limited’, ‘we’) by a third-party provider (‘Everest Fortune Group’). Please be reminded that you are solely responsible for the trading decisions on your account. There is a very high degree of risk involved in trading. Any information and/or content is intended entirely for research, educational and informational purposes only and does not constitute investment or consultation advice or investment strategy. The information is not tailored to the investment needs of any specific person and therefore does not involve a consideration of any of the investment objectives, financial situation or needs of any viewer that may receive it. Kindly also note that past performance is not a reliable indicator of future results. Actual results may differ materially from those anticipated in forward-looking or past performance statements. We assume no liability as to the accuracy or completeness of any of the information and/or content provided herein and the Company cannot be held responsible for any omission, mistake nor for any loss or damage including without limitation to any loss of profit which may arise from reliance on any information supplied by Everest Fortune Group.

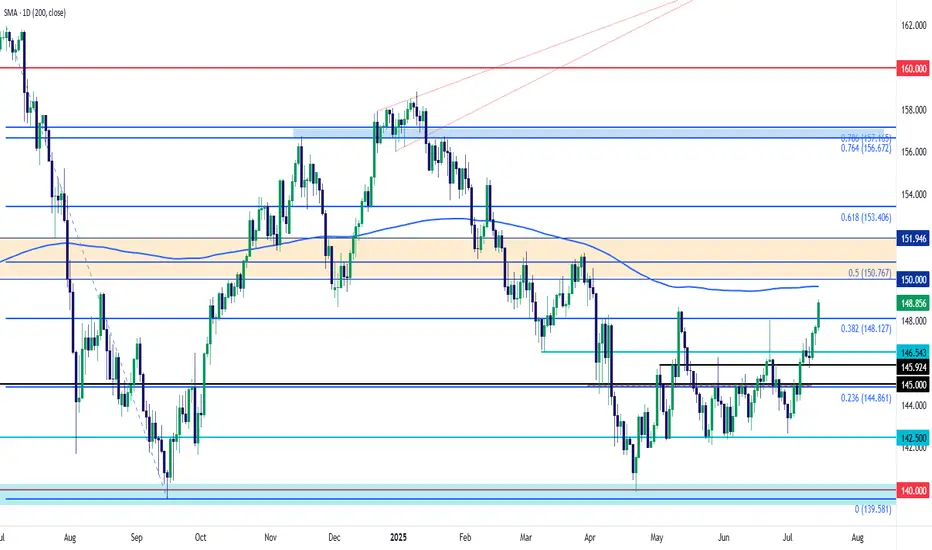
USD/JPY Breakout, 3-Month HighsUSD/JPY has had several large reactions to U.S. CPI prints over the past couple of years, including the reversal last July that saw more than 2,000 pips taken-out as the spillover of carry unwind hit global equity markets.
As recession fears hit in the U.S. in the first-half of the year, USD/JPY was in a vulnerable state until finding support at the familiar 140.00 handle in late-April. Since then, however, even as the USD posted fresh multi-year lows, USD/JPY held higher-lows with respect of the 140.00 level from April and then 142.50 in May and June.
And now that U.S. CPI is heading higher, bringing to question the rate cuts markets are still pricing in around the Fed into the end of the year, USD/JPY shorts are being squeezed again, allowing for fresh three-month highs in the pair.
USD/JPY has been difficult to chase this year and there's some resistance sitting overhead, in the form of the 200-day moving average and then the 150.00 psychological level. For support, the 148.13 Fibonacci level is of note for pullback scenarios. - js
USD/JPY ticks higher today!USDJPY has been trading strongly bullish in couple of days now and it seems the momentum ain’t slowing down anytime soon! Yes, this is a good time to opt in for a buy once we get any opportunity for that. We’re looking forward to tracking the market for a time price will begin to make a pullback so as to opt in for a buy.

USDJPYGiven the strong net long positioning on the U.S. Dollar (DXY) and the relatively weaker net positioning on the Japanese Yen (JPY) reflected in the latest COT report, we can anticipate a continued bullish outlook for USD/JPY.

USDJPY 30Min Engaged ( Buy Entry Detected )➕ Objective: Precision Volume Execution
Time Frame: 30-Minute Warfare
Entry Protocol: Only after volume-verified breakout
🩸 Bullish From now Price : 147.900
➗ Hanzo Protocol: Volume-Tiered Entry Authority
➕ Zone Activated: Dynamic market pressure detected.
The level isn’t just price — it’s a memory of where they moved size.
Volume is rising beneath the surface — not noise, but preparation.
🔥 Tactical Note:
We wait for the energy signature — when volume betrays intention.
The trap gets set. The weak follow. We execute.
USDJPY 30Min Engaged ( Buy Entry Detected )

USDJPY - BUY Market has broken resistance level with good bullish momentum candle and we anticipate market to remain bullish.
we plan our TPs with R:R of 1:1 and 1:2 with SL as defined below HL.

USDJPY 30Min Engaged ( Buy & Sell Entrys Detected ) ➕ Objective: Precision Volume Execution
Time Frame: 30-Minute Warfare
Entry Protocol: Only after volume-verified breakout
🩸 Bullish From now Price : 147.350
🩸 Bearish Reversal Price : 147.850
➗ Hanzo Protocol: Volume-Tiered Entry Authority
➕ Zone Activated: Dynamic market pressure detected.
The level isn’t just price — it’s a memory of where they moved size.
Volume is rising beneath the surface — not noise, but preparation.
🔥 Tactical Note:
We wait for the energy signature — when volume betrays intention.
The trap gets set. The weak follow. We execute.

USDJPY Short Setup Near Key Resistance🔻 USDJPY Short Setup Near Key Resistance 🔻
Timeframe: 4H
Symbol: USDJPY
Trade Type: Short (Sell)
📌 Context:
USDJPY is approaching the psychological resistance zone at 148.00–148.50, an area that has historically triggered pullbacks. While the recent momentum is bullish, key technical indicators are flashing overbought conditions.
📉 Technical Confluence:
RSI above 70, suggesting exhaustion
Price nearing upper Bollinger Band
4H structure hints at a possible bearish divergence
Previous resistance around 148.00 held multiple times
💡 Short Idea:
I’m watching for signs of rejection or bearish candle confirmation near the 148.00–148.30 zone. If the price fails to break above, this could be an ideal place to short.
🎯 Potential Targets:
TP1: 147.20 (recent support / 50EMA on 4H)
TP2: 146.50 (mid-June consolidation zone)
⛔️ Stop Loss:
SL above 148.50, just beyond the resistance structure
⚠️ Invalidation:
A clean breakout and 4H close above 148.50 would invalidate this idea.
📝 Note: Always wait for confirmation. This is not financial advice. Use proper risk management.
#USDJPY #forex #shortidea #tradingview #priceaction #JPY #DXY #resistancezone #technicals
Adding USDJPY SHORTS now !please take a look at the 30m chart. I am short at time of writing this post.
As usual, have a higher SL and watch your position sizing. Do not be greedy and stack up unnecessarily.
Please DYODD

USDJPY 1H - market buy with a confirmed structureThe price has bounced from a key support zone and is showing early signs of recovery. A clear base has formed, and the MA50 is starting to turn upward, indicating a shift in short-term momentum. While the MA200 remains above the price, the overall structure suggests a potential continuation of the bullish move.
Trade #1 — entry at market, target: 145.939, stop below recent local low.
Trade #2 — entry after breakout and retest of 145.939, target: 148.000, stop below the retest zone.
Volume has stabilized, and the reaction from support is clear. As long as price holds above the last swing low, buying remains the preferred strategy.