USDJPY Will Fall! Sell!
Take a look at our analysis for USDJPY.
Time Frame: 12h
Current Trend: Bearish
Sentiment: Overbought (based on 7-period RSI)
Forecast: Bearish
The price is testing a key resistance 147.518.
Taking into consideration the current market trend & overbought RSI, chances will be high to see a bearish movement to the downside at least to 144.599 level.
P.S
The term oversold refers to a condition where an asset has traded lower in price and has the potential for a price bounce.
Overbought refers to market scenarios where the instrument is traded considerably higher than its fair value. Overvaluation is caused by market sentiments when there is positive news.
Disclosure: I am part of Trade Nation's Influencer program and receive a monthly fee for using their TradingView charts in my analysis.
Like and subscribe and comment my ideas if you enjoy them!
JPYUSD trade ideas

USDJPY: Trend in 2H time framePlease pay special attention to the very accurate trend, colored levels, and red level as SL.
Be careful
BEST
MT

USDJPYThe dollar remained stuck in its recent trading range on Wednesday, with investors choosing to stay on the sidelines after another round of weak U.S. data and as President Donald Trump prepared to fill a coming vacancy on the Federal Reserve's Board of Governors.
Trump said on Tuesday he will decide on a nominee to replace outgoing Fed Governor Adriana Kugler by the end of the week and had separately narrowed the possible replacements for Fed Chair Jerome Powell to a short list of four.
Data on the same day showed the U.S. services sector activity unexpectedly flatlined in July while input costs climbed by the most in nearly three years, underscoring the hit from Trump's tariffs on the economy, which have also begun to bite corporate earnings.

USDJPY Is Very Bearish! Sell!
Here is our detailed technical review for USDJPY.
Time Frame: 9h
Current Trend: Bearish
Sentiment: Overbought (based on 7-period RSI)
Forecast: Bearish
The market is on a crucial zone of supply 150.492.
The above-mentioned technicals clearly indicate the dominance of sellers on the market. I recommend shorting the instrument, aiming at 148.583 level.
P.S
We determine oversold/overbought condition with RSI indicator.
When it drops below 30 - the market is considered to be oversold.
When it bounces above 70 - the market is considered to be overbought.
Disclosure: I am part of Trade Nation's Influencer program and receive a monthly fee for using their TradingView charts in my analysis.
Like and subscribe and comment my ideas if you enjoy them!

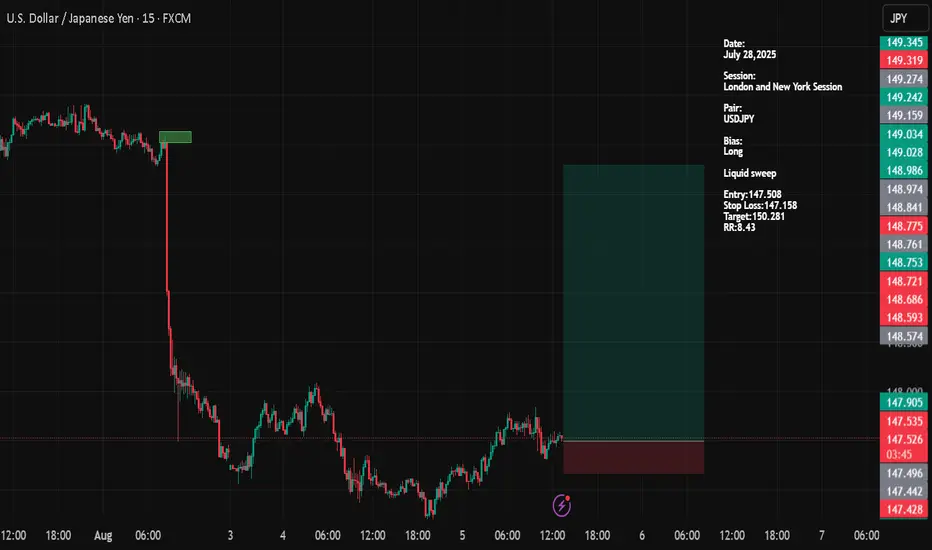
USDJPYDate:
August 05,2025
Session:
New York Session
Pair:
USDJPY
Bias:
Long
Liquid sweep
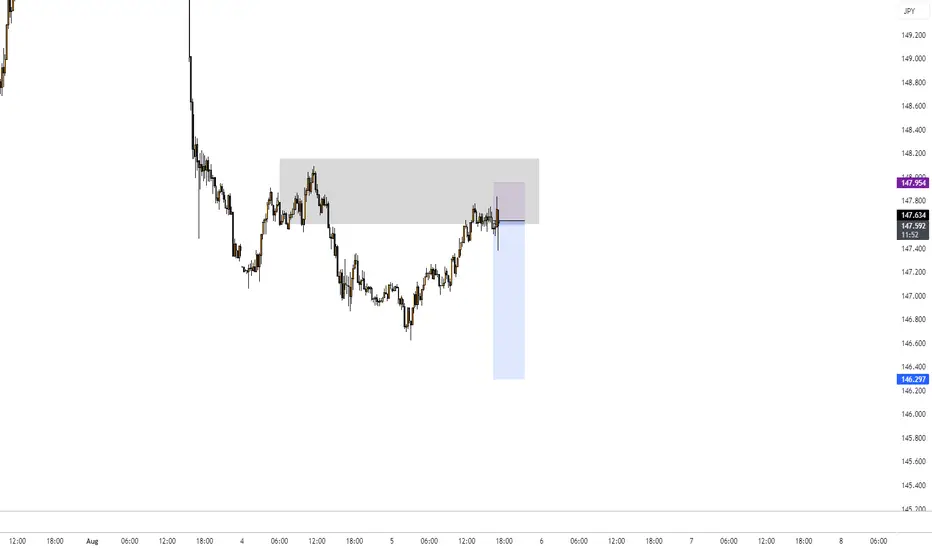
Entry:147.508
Stop Loss:147.158
Target:150.281
RR:8.43
USDJPY short position 04/08/2025English : According to our analysis, we anticipate a bearish scenario.
Morocan Darija : kanchofo d'apres l'analyse dyalna antsanaw hboot
ATENTION : I only share my ideas, not signals

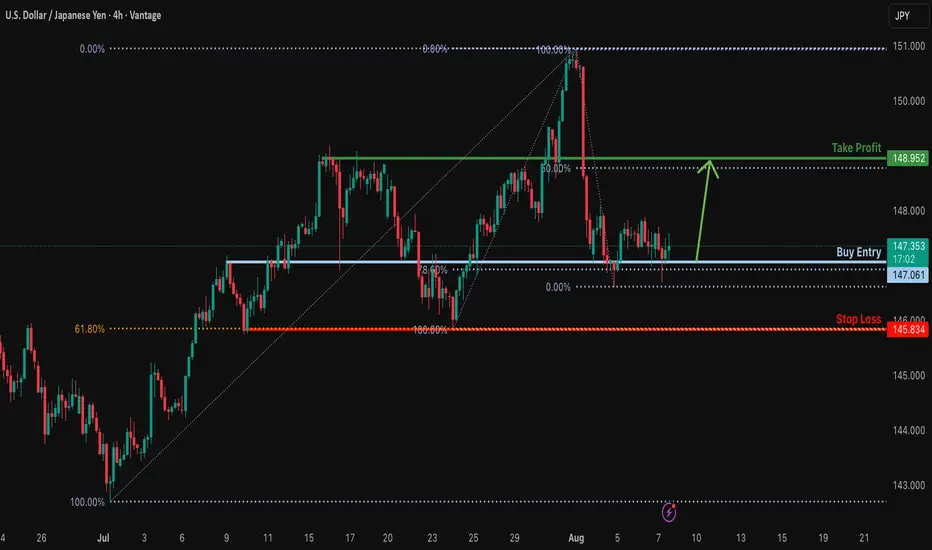
Bullish reversal?USD/JPY is reacting off the support level which is an overlap that aligns with the 78.6% Fibonacci retracement and could bounce from this level to our take profit.
Entry: 147.06
Why we like it:
There is an overlap support level that lines up with the 78.6% Fibonacci retracement.
Stop loss: 145.83
Why we like it:
There is a multi-swing low support.
Take profit: 148.95
Why we like it:
There is a pullback resistance level that is slightly above the 50% Fibonacci retracement.
Enjoying your TradingView experience? Review us!
Please be advised that the information presented on TradingView is provided to Vantage (‘Vantage Global Limited’, ‘we’) by a third-party provider (‘Everest Fortune Group’). Please be reminded that you are solely responsible for the trading decisions on your account. There is a very high degree of risk involved in trading. Any information and/or content is intended entirely for research, educational and informational purposes only and does not constitute investment or consultation advice or investment strategy. The information is not tailored to the investment needs of any specific person and therefore does not involve a consideration of any of the investment objectives, financial situation or needs of any viewer that may receive it. Kindly also note that past performance is not a reliable indicator of future results. Actual results may differ materially from those anticipated in forward-looking or past performance statements. We assume no liability as to the accuracy or completeness of any of the information and/or content provided herein and the Company cannot be held responsible for any omission, mistake nor for any loss or damage including without limitation to any loss of profit which may arise from reliance on any information supplied by Everest Fortune Group.
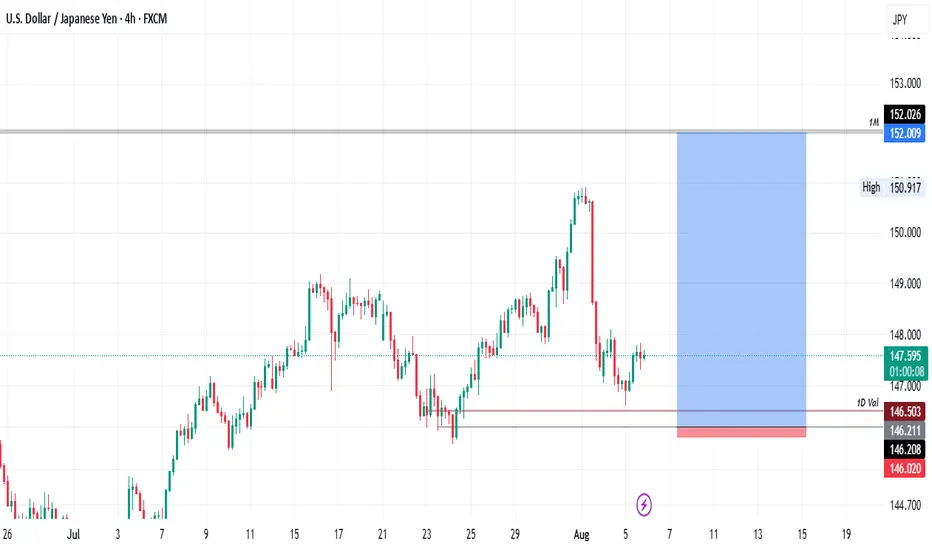
USDJPY - What do you think?- In the monthly (higher timeframes), USDJPY is bullish.
- In the weekly timeframe, USDDJPY is bullish with a clear BOS and a retest.
- In the daily timeframe, it is also in a clear uptrend.
- As convincing as it is to keep our focus on the current bullish price reaction, patience tells us otherwise to wait it out lower below the 1d validation and its preceding price structures.
- We are risking 19 Pips on this trade for a potential 1:30.
BoJ minutes indicate more rate hikes coming, yen dipsThe Japanese yen is in negative territory on Tuesday. In the European session, USD/JPY is trading at 147.74, up 0.45% on the day.
The Bank of Japan minutes from the June policy meeting were somewhat dovish, but the yen has still headed lower today. The minutes indicated that most BoJ members favored keeping interest rates unchanged, since there were downside risks to Japan's economy due to US tariffs. Still, Governor Ueda and most members support further rate hikes down the road, provided that inflation and growth continue to increase in line with the BoJ projections.
This stance was reiterated at last week's meeting, with the BoJ signalling that it planned further rate hikes if inflation and growth increased. At the meeting, the BoJ revised up its inflation forecasts for this fiscal year to 2.7%, from 2.2% in the April forecast. The central bank also raised its growth forecast by 0.1% from the April forecast.
The June meeting took place prior to the US-Japan trade agreement, which the BoJ said has reduced trade uncertainty. The trade deal should pave the way for another rate hike before the end of the year. The BoJ reacted positively to the agreement, which applies 15% tariffs on most Japanese imports to the US.
The ISM services PMI is expected to accelerate to 51.5 in July, compared to 50.8 in June. The services sector is back in expansion territory after a rare contraction (49.9) in May. Services purchase managers pointed to the uncertainty over tariff impacts as their number one concern.
On Friday, ISM Manufacturing PMI slipped to 48.0 for July, down from 49.5 in June. This marked the fifth consecutive contraction for manufacturing.
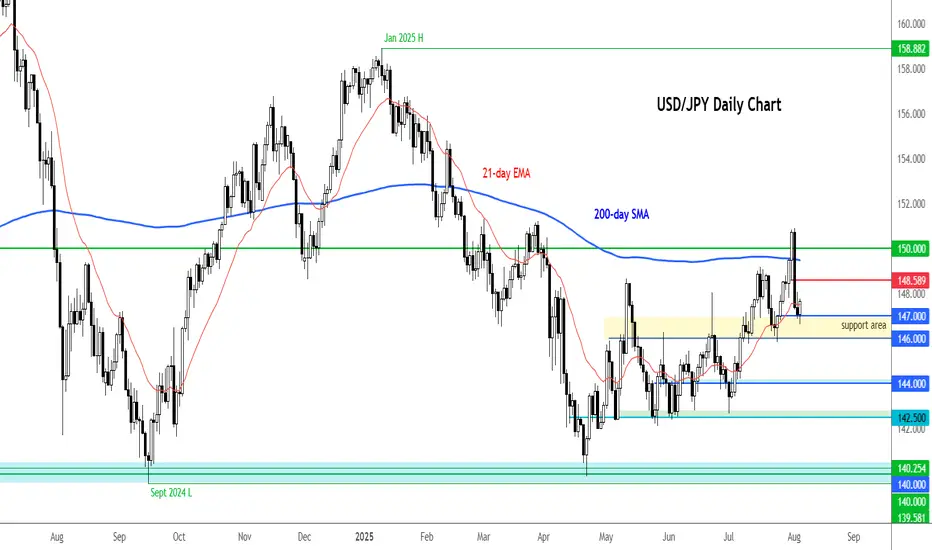
USD/JPY bounced off key support ahead of ISM surveyAfter Friday's weak jobs report and the downward revisions to prior readings, the mood shifted towards the dollar, with markets leaning towards the Fed delivering more than a couple of rate cuts this year. But we have seen a bit of a recovery in the USD since, suggesting investors are either expecting employment to pick up again or inflation to remain sticky amid higher tariffs.
Today’s attention turns to the ISM services report for July, where a modest uptick is expected. Should that materialise, it could give the dollar some further support following Friday’s wobble. We’ll also be hearing from Fed officials Susan Collins and Lisa Cook on Wednesday – and their comments may well shape expectations heading into the autumn.
Ahead of these events, the USD/JPY has bounced off the key support range we highlighted yesterday, between 146.00-147.00 area. A close below this zone would be a bearish outcome, but while it continues to hold we would favour looking for bullish trades than bearish ones. 148.60 then 150.00 are the next key levels to watch on the upside.
By Fawad Razaqzada, market analyst with FOREX.com
CARRY TRADE RISK IT IS SHOWING CRACKSThe chart posted in my work on TSXV:USS yen I have NOT CHANGED THE WAVE STRUCTURE AT ALL take notice of my statement CRASH COMING

Another chance to buyI think there is enough volume in the market to push the price up.
The 1-hour candle has good momentum.

USD/JPY...LongPrice is on an uptrend on the daily TF and is reaching a major support zone to continue to the upside.

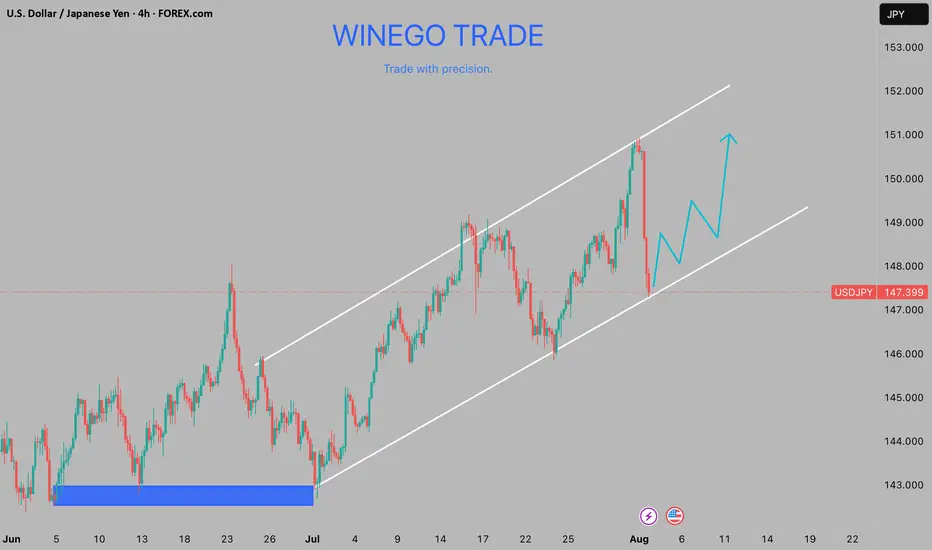
UDSJPY DRIVEN BY A BULLISH TRENDThe USDJPY pair is currently trading within a well-defined upward channel, showcasing a bullish trend that has been unfolding over recent periods. This upward trajectory is supported by a series of higher lows, with the most recent formation occurring near the 147.40 support level.
The pair's ability to hold above this level and potentially bounce off the trend-line suggests a strong foundation for further upside movement. A key level to watch in this context is 147.80, which, if breached to the upside, would likely provide further confirmation of the bullish momentum. Such a break would not only reinforce the existing upward trend but also potentially accelerate the pace of the advance.
In conclusion, the USDJPY pair's current technical setup appears conducive to further upside movement, driven by the bullish trend within the upward channel and supported by the recent higher low formation. A break above 147.80 would be a key catalyst for accelerating the bullish momentum, potentially paving the way for a move towards higher resistance levels.
USDJPY I Technical and Fundamental Analysis Welcome back! Let me know your thoughts in the comments!
** USDJPY Analysis - Listen to video!
We recommend that you keep this on your watchlist and enter when the entry criteria of your strategy is met.
Please support this idea with a LIKE and COMMENT if you find it useful and Click "Follow" on our profile if you'd like these trade ideas delivered straight to your email in the future.
Thanks for your continued support!

USDJPY - NEW BREAKOUT !Hello Traders !
The USDJPY broke the resistance level (148.831 - 149.185).
This key level becomes new support!
So, I expect a bullish move🚀
_______________
TARGET: 150.605🎯

USD/JPY - IMPORTANT UPDATEDear Friends in Trading,
How I see it,
KEYNOTE:
As long as price remains below the "PIVOT AREA" the pair will remain "BEARISH".
Pivot area range: 147.950 - 148.150
Be careful to buy, there is institutional fundamentals at play here during this time.
I sincerely hope my point of view offers a valued insight
Thank you for taking the time study my analysis.

Key Observations 1. Rectangle + Double Top (“Top 2”) Formation (left side):
• Price ranged between ~147.5 and ~149.5.
• A double top inside the rectangle signaled resistance and potential reversal.
• Breakdown from the rectangle zone occurred, confirming bearish momentum.
2. Rising Wedge Pattern (right side, green zone):
• A bearish pattern forming higher highs and higher lows.
• The red arrow indicates an expected breakdown from the wedge.
3. Bearish Price Projection (blue arrows):
• The chart projects a sharp drop following the wedge breakdown.
• Multiple target levels are marked:
• First Target: ~147.0 zone.
• Final Target: Near 144.0, aligning with the measured move from previous breakdown.
4. Confluence of Bearish Signals:
• Rectangle breakdown + rising wedge.
• Bearish candle rejection near 149 resistance.
• Pattern-based technical targets drawn using past behavior.

USDJPY Will Grow! Buy!
Here is our detailed technical review for USDJPY.
Time Frame: 12h
Current Trend: Bullish
Sentiment: Oversold (based on 7-period RSI)
Forecast: Bullish
The market is testing a major horizontal structure 147.215.
Taking into consideration the structure & trend analysis, I believe that the market will reach 150.314 level soon.
P.S
The term oversold refers to a condition where an asset has traded lower in price and has the potential for a price bounce.
Overbought refers to market scenarios where the instrument is traded considerably higher than its fair value. Overvaluation is caused by market sentiments when there is positive news.
Disclosure: I am part of Trade Nation's Influencer program and receive a monthly fee for using their TradingView charts in my analysis.
Like and subscribe and comment my ideas if you enjoy them!

USDJPY - SERA - Market StructureUSDJPY - SERA - Market Structure - use risk and trade managment for best result
Buy position🔵 **147.000** | Respected beautifully – formed a clear bullish base.
✅ This is a **valid bullish break** of the 147.500–147.600 resistance block.
✅ Candle body is **strong**, suggesting momentum.

USDJPY BUY IDEA1. Ascending Channel Structure
Price has been respecting a rising channel for several weeks.
Currently testing channel support (lower trendline).
This suggests a critical decision point: bounce or break.
2. 200 EMA (likely)
Price is hovering just above a long-term moving average, acting as dynamic support.
A clean break below this could trigger bearish momentum.
3. Support & Resistance Zones
A gray demand zone aligns with recent consolidation (support area).
Price is hovering near this demand zone, meaning buyers could step in here.
Overhead resistance (at ~151.045) marks the final target zone for the long setup.
4. Long Position Markup
A buy setup is marked with:
Entry: Around 147.150
Stop Loss: Around 146.385
Take Profit: 151.045
Risk-Reward Ratio: ~1:5 (very favorable)
5. Bearish Candlestick Pressure
Recent candles show multiple rejections and pressure near structure.
But no clean break below the trendline or EMA yet.

USDJPY
The market is currently in a "decision zone", meaning price action around current levels will determine the next major move.
Direction Probability Confirmation Condition
📈 Bullish move to 155.733 ✅ 60–65% Hold above 147 support and break above 151 resistance
📉 Bearish move to 144/140 ❌ 35–40% Confirmed daily candle break below 147 level
