USDJPY-bias long Bullish indications:
Major support respected
Inverted HS formation in 15 min time frame.
Inverted hammer candle in 4 hr
Bullish divergence in 1 hr
Trend line resistance broken .
Bearish indications:
Lower lows lower highs.
Trade plan bias long @ 140.815
SL:140.429
TP1:141.300
TP2:141.708
JPYUSD trade ideas

USDJPY Is Going Down! Short!
Please, check our technical outlook for USDJPY.
Time Frame: 12h
Current Trend: Bearish
Sentiment: Overbought (based on 7-period RSI)
Forecast: Bearish
The market is approaching a key horizontal level 145.574.
Considering the today's price action, probabilities will be high to see a movement to 144.101.
P.S
Please, note that an oversold/overbought condition can last for a long time, and therefore being oversold/overbought doesn't mean a price rally will come soon, or at all.
Disclosure: I am part of Trade Nation's Influencer program and receive a monthly fee for using their TradingView charts in my analysis.
Like and subscribe and comment my ideas if you enjoy them!

Yen Edges Higher as Inflation SurgesThe Japanese yen traded stronger near 145 per dollar, rebounding as Japan’s core inflation rose for the third straight month to 3.7%, its highest since January 2023. The data strengthens expectations that the Bank of Japan may continue policy tightening.
Earlier in the week, the BOJ held rates at 0.5% but highlighted how rising wages are being passed on to consumers, keeping inflation elevated. Governor Kazuo Ueda emphasized a data-driven path forward, keeping the door open for more hikes if needed.
The key resistance is at $145.30, while the major support is located at $142.50.
USDJPYUSD (DXY-based futures):
➤ +1,402 → modest net-long position (buying bias)
JPY (Japanese Yen futures):
➤ +144,595 → extremely net-long, near record levels
What This Means:
USD +1,402 = Mild bullish sentiment — large traders are slightly buying USD, but not aggressively.
JPY +144,595 = Very strong bullish sentiment — hedge funds and institutions are heavily buying JPY, suggesting they expect it to strengthen.
This gives a bearish bias for USD/JPY:
If JPY buying continues, USD/JPY may decline.
Bias: Short USD/JPY

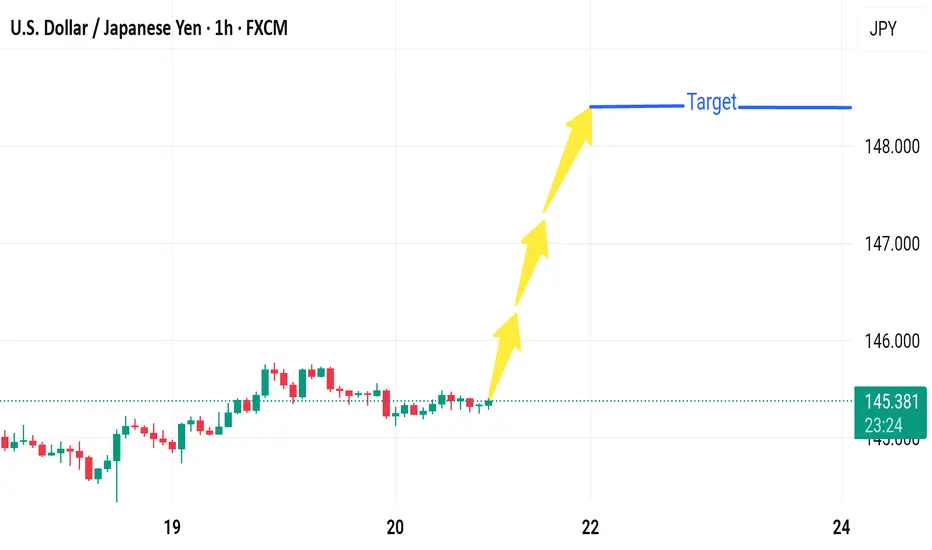
Market next move 🔻 Disruptive Analysis – Bearish Scenario
1. Resistance Rejection:
Price has stalled around 145.40, showing hesitation.
The target area (~148.000) hasn't been tested yet, and prior attempts to break higher may face heavy resistance from institutional sell orders or prior supply zones.
2. Range-Bound Structure:
Current price action shows consolidation — multiple small-bodied candles.
Lack of volume or momentum may indicate accumulation or distribution — not necessarily a bullish breakout setup.
3. Potential Bearish Triggers:
If price breaks below 145.00, a short-term bearish move could occur toward:
144.30 – recent swing low support.
143.80 – demand zone based on prior accumulation.
4. Macro Disruptors:
Surprise BoJ intervention or hawkish policy tone could strengthen the Yen.
A dovish Fed statement or poor U.S. economic data could drag USD down sharply.
---
📉 Alternate Scenario Chart Sketch (Hypothetical):
148.000 ──────── (Target denied - strong resistance)
↑
Rejection
↓
145.000 ──────── (Breaks support)
↓
144.300 ──────── (First bearish target)
↓
143.800 ──────── (Deeper retracement zone)
USD/JPY 4-Hour Forex Chart (June 20, 2025)4-hour candlestick chart from FOREX.com displays the USD/JPY currency pair's performance, showing a current value of 145.328 with a slight decrease of 0.112 (-0.08%). The chart highlights a recent downward trend following a peak near 145.950, with a shaded area indicating a potential resistance zone around 145.500-145.950. The time frame spans from early June to the present date, with key levels marked at 145.000, 144.478, and higher resistance points.

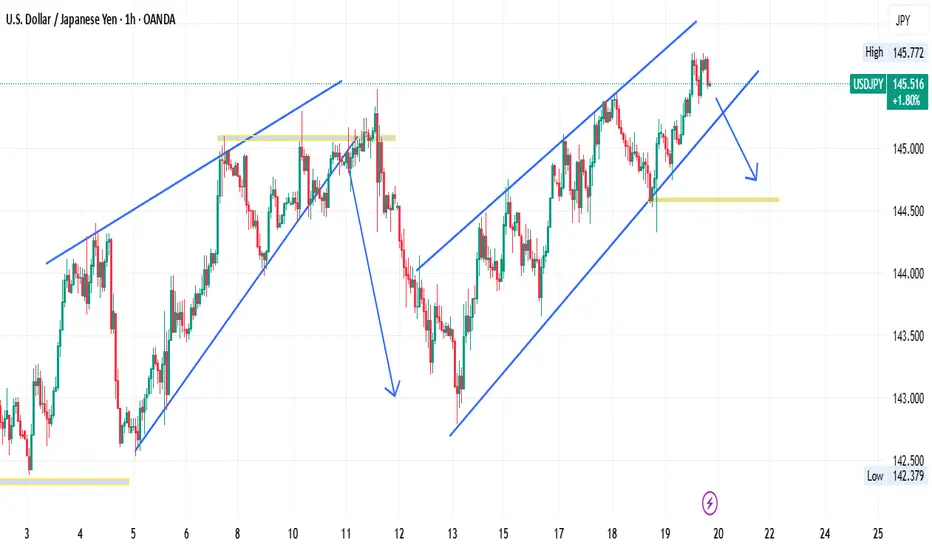
USDJPY | BullishUSDJPY is in bullish continuation pattern with ascending channel formation and bullish divergence on RSI.

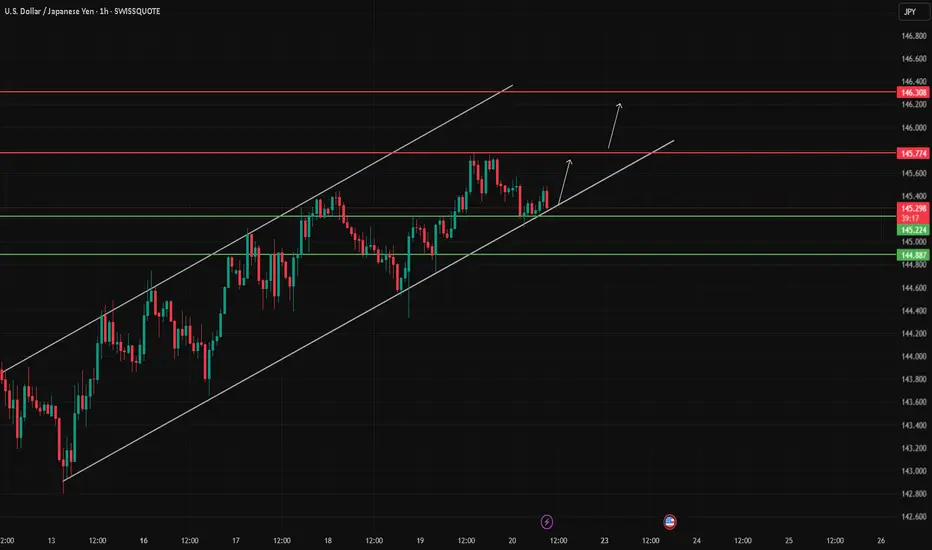
USD/JPY Holding Channel Support – Can Bulls Reach 146.30 ?USD/JPY continues to trade within a clean ascending channel.
Price is currently testing the lower boundary of the channel near 145.224 – 145.320, which aligns with intraday support.
If this zone holds, a bounce toward 145.774 and then 146.308 is likely.
A break below 144.887 would invalidate the bullish structure.
This is a technical analysis idea – not financial advice.
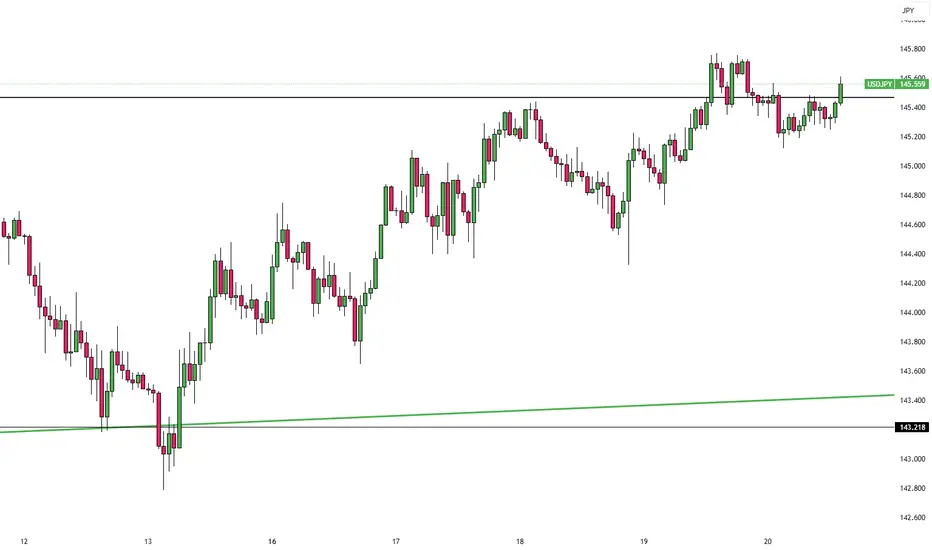
Fundamental Market Analysis for June 20, 2025 USDJPYThe Japanese yen (JPY) strengthened slightly against the US dollar during Friday's Asian session and moved away from the monthly low reached the day before. Data released by the Japanese government showed that the annual consumer price index (CPI) in May remained well above the Bank of Japan's (BoJ) target of 2%. This confirms market expectations that the BoJ will raise interest rates again and is a key factor driving the moderate growth of the JPY.
Meanwhile, ongoing trade uncertainty and further escalation of geopolitical tensions in the Middle East continue to weigh on investor sentiment, further strengthening the JPY's status as a safe haven. In addition, the moderate decline in the US dollar (USD) is pulling the USD/JPY pair back towards the psychological level of 145.000. However, expectations that the BoJ may keep rates unchanged until the first quarter of 2026, as well as the Federal Reserve's (Fed) hawkish pause earlier this week, may limit the pair's losses.
Market participants are paying extra attention to upcoming economic releases from the US, including inflation and labor market data, which could influence the Fed's monetary policy trajectory. If the statistics prove strong, this could strengthen the dollar and put pressure on the yen. However, the continuing weakness in the global economic recovery and high Japanese inflation continue to support expectations of a gradual tightening of BoJ policy, creating an ambiguous outlook for the USD/JPY exchange rate in the short term.
Trading recommendation: SELL 145.400, SL 145.700, TP 144.300

USD/JPY(20250620)Today's AnalysisMarket news:
The Bank of England kept interest rates unchanged at 4.25%, and the voting ratio showed that internal differences were increasing. Traders expect the bank to cut interest rates by another 50 basis points this year.
Technical analysis:
Today's buying and selling boundaries:
145.32
Support and resistance levels:
146.35
145.96
145.72
144.93
144.68
144.30
Trading strategy:
If the price breaks through 145.72, consider buying, and the first target price is 145.96
If the price breaks through 145.32, consider selling, and the first target price is 144.93

USDJPY 15M CHART PATTERNHere's a structured summary of your USDJPY trade setup:
---
📈 Trade Idea: Buy USDJPY
Entry (Buy): 145.200
Stop Loss: 144.750 ✅ (Risk: 45 pips)
---
🎯 Take Profit Levels
1. TP1: 145.500 (Profit: 30 pips)
2. TP2: 145.930 (Profit: 73 pips)
3. TP3: 146.466 (Profit: 126.6 pips)
---
🔍 Trade Notes
Risk-Reward Ratios:
TP1: ~0.67:1
TP2: ~1.62:1
TP3: ~2.81:1
This is a layered take-profit strategy — you can close portions of the position at each level or trail the stop.
Make sure to adjust lot sizes accordingly if you're scaling out at each TP.
---
Would you like help creating a risk management plan or getting this formatted for MT4/5 or another trading platform?

USD/JPY 2-Hour Forex Chart2-hour candlestick chart from FOREX.com displays the exchange rate between the U.S. Dollar (USD) and the Japanese Yen (JPY). The current rate is 145.513, with a slight increase of +0.074 (+0.05%). The chart shows price movements over the past 2-hour period, with a notable upward trend followed by a recent decline, as highlighted by the shaded area indicating a potential resistance or reversal zone. Key levels such as 145.701 and 145.106 are marked, along with the current time of 04:00.

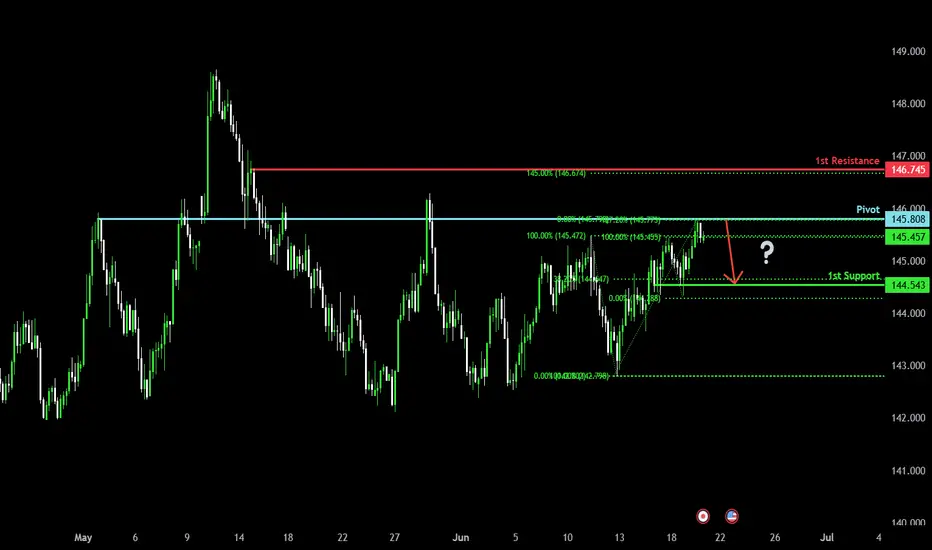
Bearish reversal?USD/JPY has reacted off the pivot and could drop to the 1st support which is a pullback support.
Pivot: 145.80
1st Support: 144.54
1st Resistance: 146.74
Risk Warning:
Trading Forex and CFDs carries a high level of risk to your capital and you should only trade with money you can afford to lose. Trading Forex and CFDs may not be suitable for all investors, so please ensure that you fully understand the risks involved and seek independent advice if necessary.
Disclaimer:
The above opinions given constitute general market commentary, and do not constitute the opinion or advice of IC Markets or any form of personal or investment advice.
Any opinions, news, research, analyses, prices, other information, or links to third-party sites contained on this website are provided on an "as-is" basis, are intended only to be informative, is not an advice nor a recommendation, nor research, or a record of our trading prices, or an offer of, or solicitation for a transaction in any financial instrument and thus should not be treated as such. The information provided does not involve any specific investment objectives, financial situation and needs of any specific person who may receive it. Please be aware, that past performance is not a reliable indicator of future performance and/or results. Past Performance or Forward-looking scenarios based upon the reasonable beliefs of the third-party provider are not a guarantee of future performance. Actual results may differ materially from those anticipated in forward-looking or past performance statements. IC Markets makes no representation or warranty and assumes no liability as to the accuracy or completeness of the information provided, nor any loss arising from any investment based on a recommendation, forecast or any information supplied by any third-party.
USD/JPY) Bearish reversal analysis Read The captionSMC trading point update
Technical analysis of USD/JPY 3-hour chart suggests a bearish reversal setup, based on smart money concepts (SMC), resistance rejection, and price action structure. Here's a full breakdown:
Technical Breakdown – USD/JPY
Big Resistance Zone (~145.800–146.300):
Price has tapped into a major resistance zone (yellow box) twice (highlighted with red arrows).
Both rejections indicate strong seller interest.
The latest candle structure shows clear rejection wick, signaling weakness at resistance.
---
Bearish Bias Confirmation:
Bearish structure forming after the second rejection.
Break of the rising trendline could accelerate selling pressure.
A measured move projection (-2.58%) aligns the downside target with the support level at ~142.144.
---
Support Zone (~141.800–142.400):
Marked as the likely target zone.
Historically acted as a strong bounce area (visible from late May to early June).
Completion of ABC bearish structure aligns here.
---
Indicators & Tools:
200 EMA (144.419): Price currently slightly above it — watching for a close below to strengthen bearish view.
RSI (14): Shows signs of bearish divergence and cooling off from overbought (was above 70 previously).
Volume spike during the rejection suggests institutional selling.
Mr SMC Trading point
---
Forecast Summary:
Bias: Bearish toward 142.144
Entry Idea: Look for confirmation of breakdown below trendline (~145.00)
Invalidation: Strong bullish close above 146.300 would break this idea.
---
Please support boost 🚀 this analysis)

Fake breakout, support, trend line and stop loss for USDJPYI am still bearish on USDJPY. However, you can see from the shorter time frame, there are multiple occasions where fake breakouts happen. This usually stops out the traders with tight SL. Unless you have a clear strategy, after being stopped out from this pair, it is highly likely that you will move on to other pairs/asset classes to find your next pot of gold.
But if you are persistent and have the patience, you will notice this fake breakout patterns. It is getting shorter and shorter. Now, with the support at 142.472, a breakdown will be great as it sends the price to 140 level.
If you wants to short now, it would be better to have a wider SL, say 145.60 , the previous peak where it is more likely not to surpass. A higher SL will mean you cannot be greedy in your position size initially to rein in the gains if it moves in your favour. It is better to have a small position and the market agrees with you than to go on an aggressive mode of say 5-10 contracts position size and shortly market moves against you. The stress would be too much to bear seeing the losses running........
Find one strategy that suits your personality , risk profile and work on it tirelessly.

USDJPYThere is an opportunity for a sell. Usdjpy has been following our analysis recently but lets wait and see.