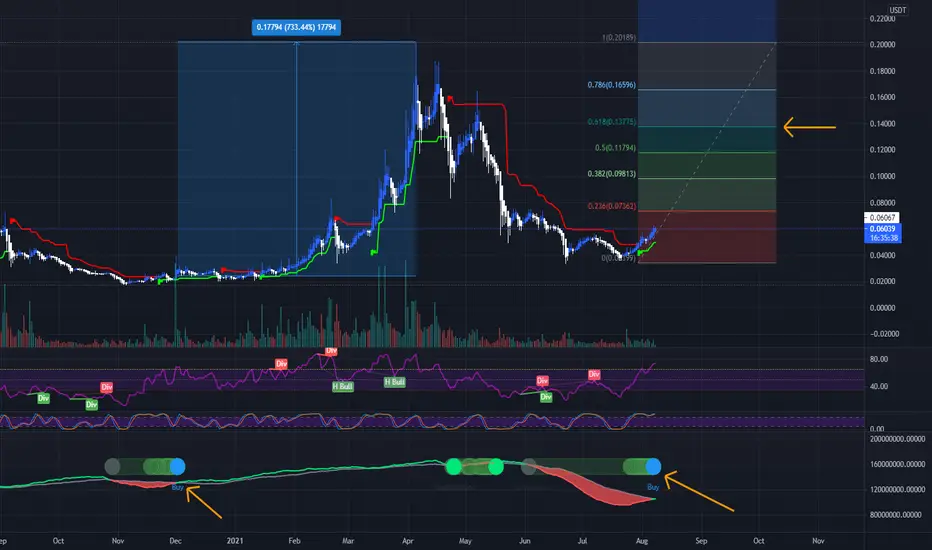
JSTUSDT Daily TimeframeSNIPER STRATEGY (new version)
It works ALMOST ON ANY CHART.
It produces Weak, Medium and Strong signals based on consisting elements.
NOT ALL TARGETS CAN BE ACHIEVED, let's make that clear.
TARGETS OR ENTRY PRICES ARE STRONG SUPPORT AND RESISTANCE LEVELS SO THEY CAN ACT LIKE PIVOT POINTS AND REVERSE THE WAVE (or act like a mirror that can reflects light) BASED ON STRENGTH OF THAT LEVEL.
ENTRY PRICE BLACK COLOR
MOST PROBABLE SCENARIOS TARGETS GREEN COLOR
LEAST PROBABLE SCENARIOS TARGETS RED COLOR
DO NOT USE THIS STROTEGY FOR LEVERAGED TRADING.
It will not give you the whole wave like any other strategy out there but it will give you a huge part of the wave.
The BEST TIMEFRAMES for this strategy are Daily, Weekly and Monthly however it can work on any timeframe.
Consider those points and you will have a huge advantage in the market.
There is a lot more about this strategy.
It can predict possible target and also give you almost exact buy or sell time on the spot.
I am developing it even more so stay tuned and start to follow me for more signals and forecasts.
START BELIEVING AND GOOD LUCK
HADIMOZAYAN
Market insights


Checking the weekly watchlistWell we're going to take a look at our most recent watch list on September 13, 2021 for this week's deals
JST /USDT
as expected 15% increase from our enter price in this week 's watchlist
Please share your comments with us and follow us
The only reason we are here is you
Thank you

JSTUSDT TECHNICAL ANALYSIS The candle already break out the triangle And another candle completely open close about the downtrend line. We got some signal from @EngineeringRobo as well. Not only that moving average strategies give us buy signal as well. If the candle or stay keep going above the up trend line it may gain more and we may earn something. We need to follow that our daily chart closely.
“NFA”

The opportunity in JST The opportunity in JST
The entry point is 0.096-0.095$
First target 0.1$
second target 0.11$
third target 0.118$
forth target 0.125
stop-loss 0.088$

JSTUSDT Mid Termhi
according to chart JST goes to 2 plans
is break up trendline next point SUP1 , that break maybe Dependent to Bitcon

JST or TRX - Comparison This is a Ratio Comparison between TRX and JST
As you can see, in a one-year period, JST can bring you far more profit than TRX.
Just is at the bottom of the chart and out of the triangle.
which one is better?


JSTUSDT Technical Analysis
⏳ Spot
💎 JSTUSDT after breaking above the resistance and the triangle is expected to go for a pullback and then go up again.
🏁 Short & Medium Term
💵 Invest Only 5% of your Portfolio
🎳 Entry at market or 0.07500
☕️ TP1 0.08800
🍺 TP2 0.09435
🍻 TP3 0.10070
🍾 TP4 0.10700
🍷 TP5 0.11500
🍸 TP6 _______
🍹 TP7 _______
🎁 TP8 _______
🚫 SL 0.07000
Good Luck 🎲
Check the Links in Description and If you LIKE this analysis, Please support our page and Ideas by hitting the LIKE 👍 button. ❤️ Your Support is really appreciated! ❤️
Traders, if you have your own opinion about it, please write your own in the comment box. We will be glad for this.
Feel free to request any pair/instrument analysis or ask any questions in the comment section below.
We will have more FREE forecasts in TradingView soon
Have a Profitable Day

JST Up 6.329% from PreliminaryJST has already netted me a 6.39% return in 2 days from a .078 preliminary entrance I took yesterday. Nice action so far.
Prognosis: With JST everything is falling into place as forecasted with these double-bottom reversal patterns. There are a helluva lot of cryptos right now in similar trading patterns. I anticipate retests at some point of the 1.272 or 1.0 Fibonaccis where new support levels will be inaugurated if BTC behaves. There we can expect new consolidation ranges to form with subsequent second and third advances to even higher Fib zones.
*Fulltime Wyckoffian VSA crypto swing trader since 2017. I regularly seek out the most lucrative swings on all the major exchanges.
All my charts are clean, straightforward, and easy to follow. No junk, no needless indicators, just solid volume spread analysis ( VSA ) and 'take-the-money-and-run' Fibonacci target zones.
I go after the runners and big money. My win rates are between 80-85%. Follow me on TradingView and see for yourself.
I review over 300 coins & tokens daily and handpick all the runners myself (no bot signals).
** Not financial advice. Trade at your own risk.


JSTUSDT coin on the targetJST my idea target JST coin on the go, lets see on the visual graph, lets discuss..


#JSTUSDT (Watchlist)#JST maybe worth it to add this coin to your Watchlist. 👀
add to watchlist means the coin we mentioned is forming a pattern or moving near a historical bottom, around or above good support, increase in trading volume , showing a reversal candle, accumulation stage, etc, but no reaction from bulls, so we inform you to add it to your watchlist until the right time for entry.!!
Ps:
we avoid trading any coin if the entire project for it is based on gambling, prostitution, human trafficking, etc.
This is not financial advice, The purpose of these Charts to give you an idea about coin movement (not buy or sell signal) so before following any idea be sure to do your own research, and follow your risk management. Also, the information we mentioned here is a personal effort that is subject to success or failure and we welcome constructive criticism.
Pressing the "like button" and leaving your "comments" below our ideas is great and supports us in providing more ideas.❤️
Good luck to All.
🙏we ask Allah reconcile and repay🙏

JSTUSDT - Long - Potential 32.19%JSTUSDT - Long - Potential 32.19%
Exchanges: Binance, Huobi.pro, KuCoin
Signal Type: Regular (Long)
Entry Zone:
0.03844 - 0.04062
Take-Profit Targets:
1) 0.04237
2) 0.04661
3) 0.05367
Stop Targets:
1) 0.03353
Entry Triggers- Volume breakup likely & heavily oversold on RSI


JSTUSDT: A few scalping ideas.There are a few buy zones in JST USDT for those who are looking for a quick 1%-1.5% scalping. TAYOR


