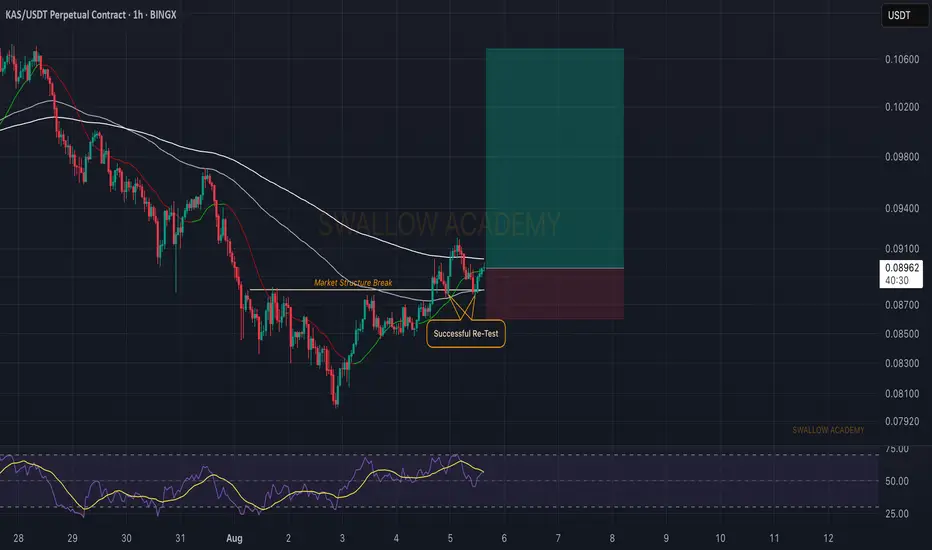
Kaspa (KAS): Market Structure Break + Re-Test = Buy EntryKaspa looks good for the long haul here, with a 1:5 risk and reward ratio. There is nothing much to say, other than as long as we keep that current buy-side momentum, we are good for a long time here.
Ideal and final confirmation would be if we would form the break of structure near the $0.92 area
Kas short to $0.0816Just now opened a short on KAS.
Sl: $0.08749
limit entry: $0.08548
Tp: $0.0816
Risk to reward: 1:2
DTT analysis applied - learn more on X

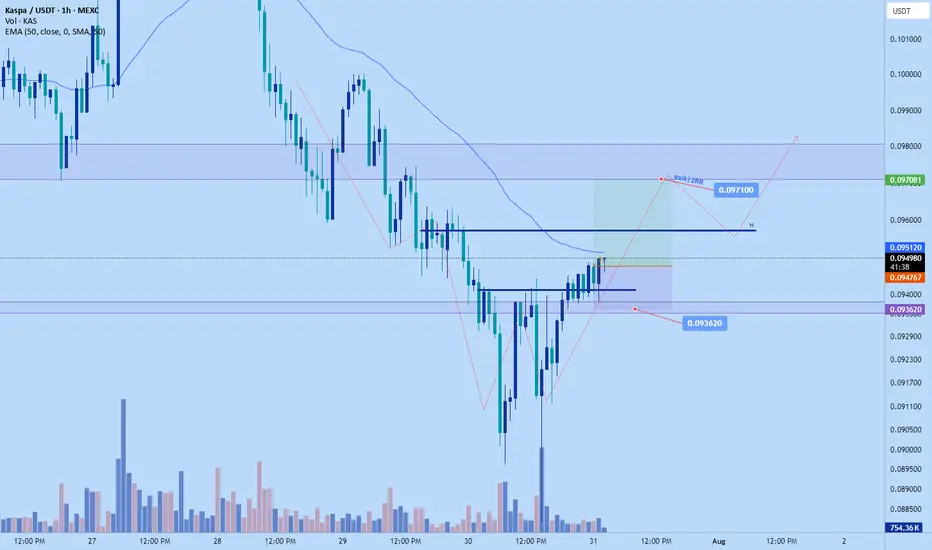
Kas scalp long to $0.0971Just now opened a long position on Kas. Based on the bulls are gaining control right now and the price is relatively low on htf
Setup aligns wit my DTT strategy
Sl: $0.093620
Time sensitive.
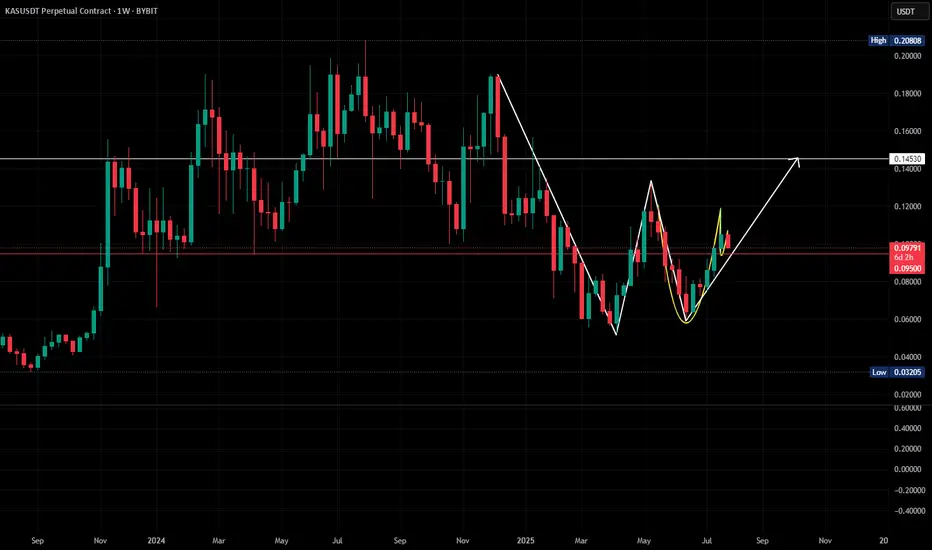
POTENTIAL LONG FOR KASPA (KAS)Timeframe: 1-Day and Weekly Charts
Current Price: $0.097946 (as at July 29, 2025)
Pattern Analysis:
Weekly Chart: Potential double bottom pattern with lows at $0.0527 and $0.0545, and neckline resistance at $0.098995. Current price of 0.0979 is testing this neckline. A breakout above $0.0990 wi
Kas short to $0.10226Just now opened up a short position on Kas. I think structurally the market is high and likely to correct down a bit more before continuation to the upside
Sl: $0.106690
TP: $1.102841-$0.102263

Kas dump back to $0.08Just now opened a new short position on KAS. Aiming for new lows around 0.08
SL: 0.088180, I think that should be conservative enough. Only went in with small size as I have 2 other positions open.
2-2.67RR
Time sensitive
DTT strategy applied

Kas short to $0.082662Just now opened up a short position on KAs
Sl: 0.086270
Tp: 0.082662
Roughly 2rr

long on $kas-0.045-0.073 accumulationno VC
No premine
No Owner
Pure bitcoin idea is kaspa
TA: Currently making lower high , W pattern, if it could se support levels at 0.055-0.065
August 31 L2 , kaspelx smart contract launch,
Igra lab also planning,

Kaspa (KAS): Seeing Possibility of Break of StructureKaspa coin struggles to have a proper buyside volume, where sellers are showing strong dominance currently, which could lead us to BOS and nasty movement to lower zones (and by nasty I mean big red candle).
Swallow Academy

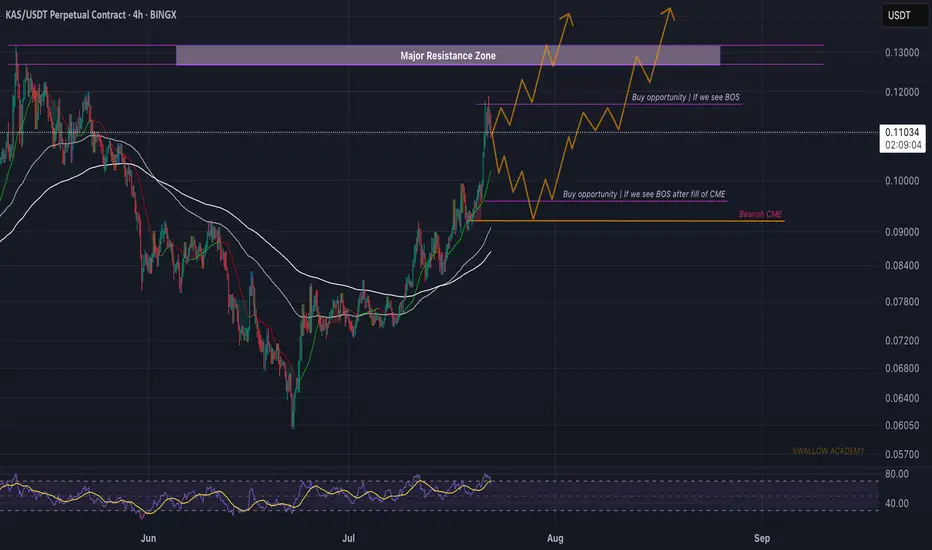
Kaspa (KAS): Looking For Break of Structure, Here or Near CMEKaspa looks pretty bearish right now, possibly going for that MSB currently, but despite that, as we are overall in a bullish trend, we are going to look for buyside movement and trading opportunities here.
So we detected 2 zones for us, one slightly above the current market price and another near
See all ideas
Summarizing what the indicators are suggesting.
Oscillators
Neutral
SellBuy
Strong sellStrong buy
Strong sellSellNeutralBuyStrong buy
Oscillators
Neutral
SellBuy
Strong sellStrong buy
Strong sellSellNeutralBuyStrong buy
Summary
Neutral
SellBuy
Strong sellStrong buy
Strong sellSellNeutralBuyStrong buy
Summary
Neutral
SellBuy
Strong sellStrong buy
Strong sellSellNeutralBuyStrong buy
Summary
Neutral
SellBuy
Strong sellStrong buy
Strong sellSellNeutralBuyStrong buy
Moving Averages
Neutral
SellBuy
Strong sellStrong buy
Strong sellSellNeutralBuyStrong buy
Moving Averages
Neutral
SellBuy
Strong sellStrong buy
Strong sellSellNeutralBuyStrong buy
Displays a symbol's price movements over previous years to identify recurring trends.