KAVA/BTC Technical Analysis
KAVA/BTC has been in a downtrend since Aug 2024, dropping from 0.0000400 to 0.0000100 BTC. However, recent signs point to a potential short-term reversal:
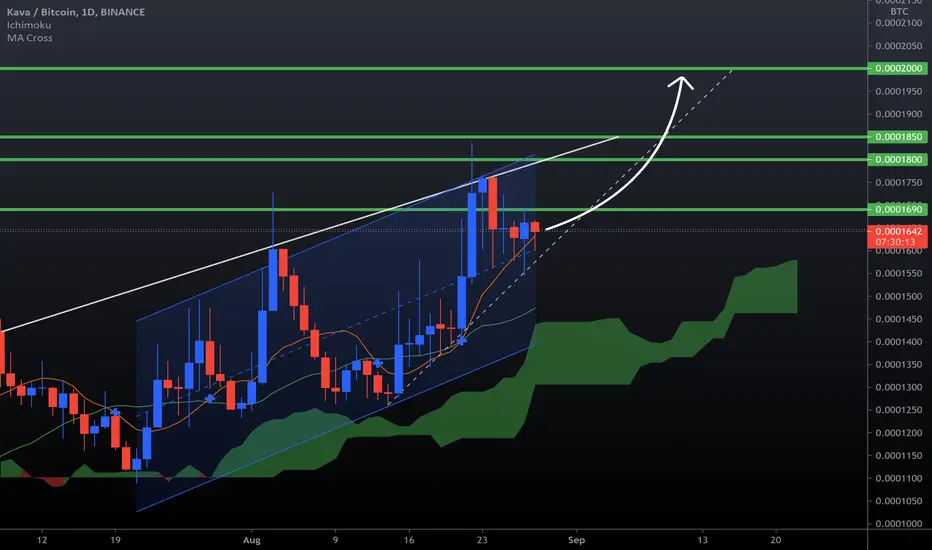
Price: Showing a slight uptick with a projected upward trend targeting 0.0000160, 0.0000180, 0.0000220, 0.0000260, and 0.0000300 BTC.
Ichimoku Cloud: Price is below the cloud (bearish), but the cloud is thinning, suggesting weaker resistance.
Volume: Rising buying volume supports the recent price increase.
RSI: At 50-60 (neutral), with room to rise.
MACD: Bullish crossover and positive histogram indicate growing upward momentum.
Outlook: A break above the Ichimoku Cloud (0.0000120-0.0000140 BTC) could confirm a trend reversal. If it fails, the price may retest support at 0.0000080 BTC. Watch for volume and price action at key levels.
KAVABTC trade ideas

KAVABTC Trading Signal: Sell OpportunityDear Traders,
We have identified a potential trading opportunity for the KAVABTC pair. Our analysis indicates a Sell signal. Here are the specific details for your consideration:
- Direction : Sell
- Enter Price : 5.96E-06
- Take Profit : 5.89E-06
- Stop Loss : 6.05E-06
Our forecast is based on the analysis performed using the EASY Quantum Ai strategy . This model considers multiple factors including:
1. Market Trend Analysis : Recent analysis of market trends shows a prevailing downtrend in KAVABTC, suggesting an opportunity to capitalize on short positions.
2. Volume Dynamics : A noticeable decrease in buying pressure supports the potential for further downside movement.
3. Resistance and Support Levels : The current resistance level has been respected, suggesting a strong potential for price retracement and hence, further declines.
4. Technical Indicators : Key technical indicators have shown bearish momentum, pointing towards a likely continuation downward.
Bear in mind that all signals should be corroborated with your market analysis tools and risk management strategies. Stay vigilant of any market changes and trade wisely.
Disclaimer: Past performance is not an indicator of future results. Always conduct your research.
Kava | Triple Bottom (The Altcoins Are Heating Up!)Kava is making a decisive move just now as financial independence day comes to a close.
Here we can see a "bottom" being tested three times before a bullish breakout develops.
➖ KAVABTC hit bottom 5-August. This same low is tested again 4-September and then again yesterday. Needless to say, every time the support level holds strong.
➖ Today we have a clear bullish move that is supported by high volume. The fact that it is happening after support was tested three times in a short-term period and holds gives power to the bullish case. We can expect growth on this pair.
The targets on the charts are for the short-term to mid-term. Long-term there can be much more growth, because we are about to experience the first uptrend for this pair since 2021. It will be big.
The Altcoins are heating up.
Namaste.

✳️ Kava Moving Above MA200, Major Bullish PotentialOnce the bottom is hit, the only place left to go is up.
The lower it goes the better it gets.
The stop-loss being activated is good news; no more sellers, only buyers remain.
A steep decline is matched by a steep rise; fast down, fast up.
The market goes up and down, up and down... KAVABTC went down for a while and it is now the time for it to keep going up.
Today resistance is being met as MA200 but just as prices grow.
The bullish bias is strong and we expect additional growth.
Namaste.

KAVA/BTC - Kava: Resistance_Breakout_Confirmation◳◱ A Resistance Breakout and Confirmation has been detected on the CRYPTOCAP:KAVA / CRYPTOCAP:BTC chart. The price has broken above a key resistance level and has been confirmed by a strong candle, indicating a potential bullish trend. The next resistance key levels are located at 0.00004299 | 0.00004862 | 0.00006386, and the major support zones can be found at 0.00002775 | 0.00001814 | 0.0000029. Consider entering a trade at the current price zone of 0.00003846 and targeting higher levels.
◰◲ General info :
▣ Name: Kava
▣ Rank: 79
▣ Exchanges: Binance, Huobipro, Kraken, Hitbtc
▣ Category/Sector: Infrastructure - Smart Contract Platforms
▣ Overview: Kava is a fast and secure Layer-1 blockchain featuring a unique co-chain architecture that combines the speed and interoperability of the Cosmos SDK with the flexibility and developer support of the Ethereum Virtual Machine (EVM).
Kava has a native governance and utility token, KAVA, that can be staked by validators or delegated to validator nodes.
◰◲ Technical Metrics :
▣ Mrkt Price: 0.00003846 ₿
▣ 24HVol: 8.563 ₿
▣ 24H Chng: 6.478%
▣ 7-Days Chng: 11.60%
▣ 1-Month Chng: 21.64%
▣ 3-Months Chng: 11.10%
◲◰ Pivot Points - Levels :
◥ Resistance: 0.00004299 | 0.00004862 | 0.00006386
◢ Support: 0.00002775 | 0.00001814 | 0.0000029
◱◳ Indicators recommendation :
▣ Oscillators: NEUTRAL
▣ Moving Averages: STRONG_BUY
◰◲ Technical Indicators Summary : BUY
◲◰ Sharpe Ratios :
▣ Last 30D: -0.08
▣ Last 90D: 0.11
▣ Last 1-Y: -0.57
▣ Last 3-Y: 0.76
◲◰ Volatility :
▣ Last 30D: 0.95
▣ Last 90D: 0.88
▣ Last 1-Y: 0.96
▣ Last 3-Y: 1.34
◳◰ Market Sentiment Index :
▣ News sentiment score is N/A
▣ Twitter sentiment score is 0.67 - Bullish
▣ Reddit sentiment score is 0.58 - Bullish
▣ In-depth KAVABTC technical analysis on Tradingview TA page
▣ What do you think of this analysis? Share your insights and let's discuss in the comments below. Your like, follow and support would be greatly appreciated!
◲ Disclaimer
Please note that the information and publications provided are for informational purposes only and should not be construed as financial, investment, trading, or any other type of advice or recommendation. We encourage you to conduct your own research and consult with a qualified professional before making any financial decisions. The use of the information provided is solely at your own risk.
▣ Welcome to the home of charting big: TradingView
Benefit from a ton of financial analysis features, instruments and data. Have a look around, and if you do choose to go with an upgraded plan, you'll get up to $30.
Discover it here - affiliate link -

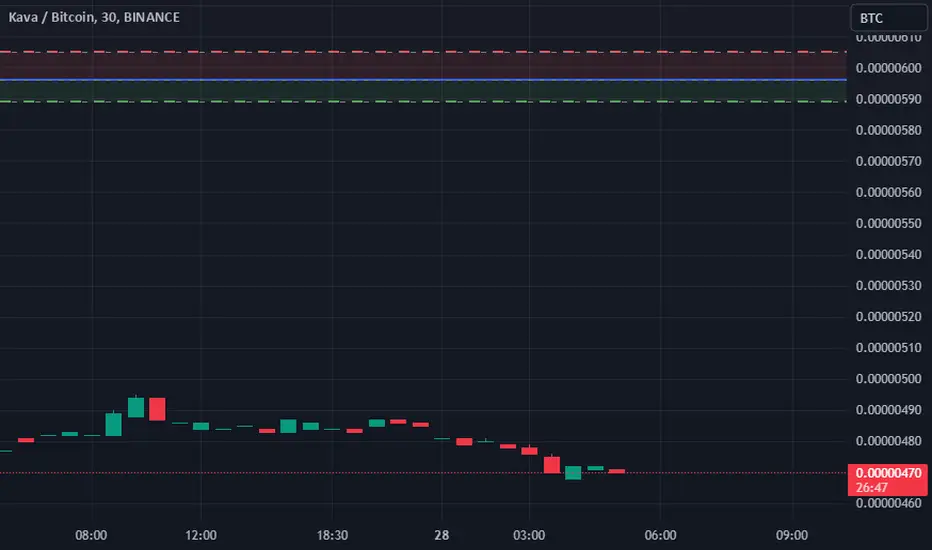
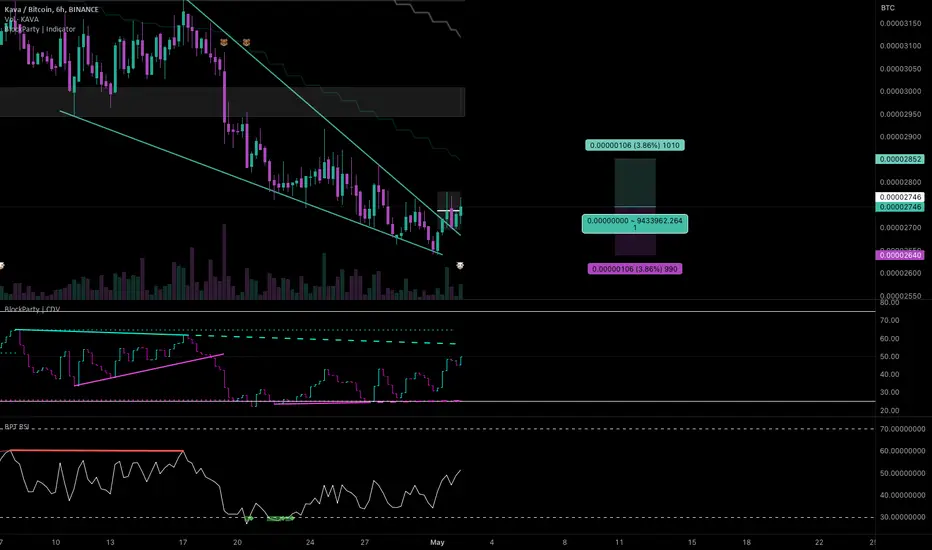
#KAVA/BTC - Long - Potential 3.86%Direction: Long
Market: Spot
Risk: 0.25% - 1%
#BTC_KAVA
Exchange: BINANCE
Timeframe: 360
TP1: 0.00002852
Entry: 0.00002746
STOP: 0.0000264
Entry Conditions:
| Falling wedge breakout
| Volume confirmed
✳️ Take This! 111.11% Potential For KavaI like the look of this chart. I am giving you a nice 111.11% potential on this trading pair.
See a bullish crossover on the MACD
✔️ The MACD line (blue) crosses over the Signal line (orange) to the upside.
✔️ The candles 4-Mar. and 7-Mar. both represent reversal signals based on Candlestick reading.
✔️ Notice the falling wedge pattern as well and if we continue looking, we find more.
✔️ Elliot Wave Theory, we have the first and second waves, a third wave follows...
I think that's enough 😁.
Namaste.

✳️ Kava Rebound Points To Easy 40%, Up To 100% PossibleWe found this one thanks to TradingView community on the front page... Very smart individuals we have in this community... They know exactly what to look for... Thank you!
Kava vs Bitcoin (KAVABTC) went oversold on the RSI for the second time in less than two months.
At the same time this is happening a bullish divergence shows up, increase in trading volume, a negative 9 on the TD Sequential followed by a bullish jump.
This bullish jump is forming a candlestick pattern called the morning star... All these combined is a strong reversal signal.
Daily candle closure green/above EMA10 is needed for good/strong confirmation.
This bounce can lead to easily to 40% but there can also be more.
Namaste.

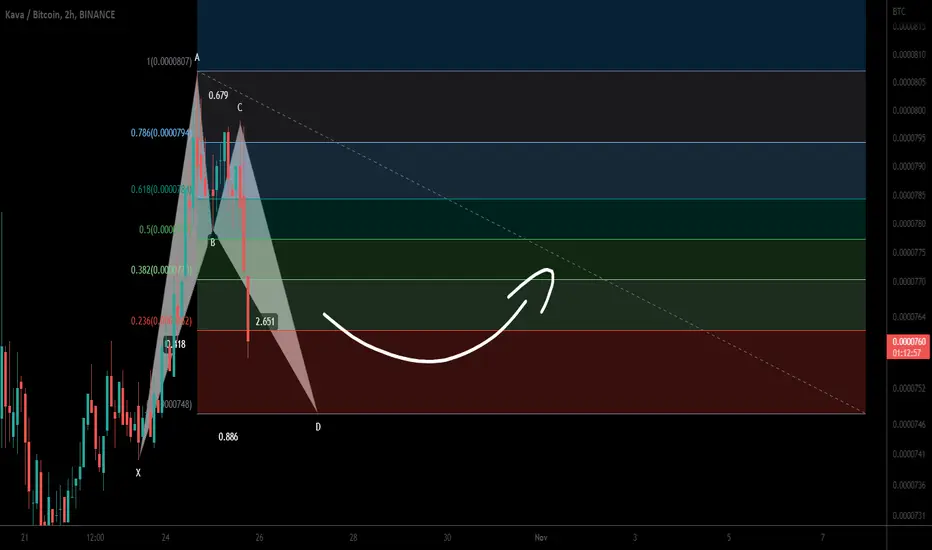
Kava. io forming bullish BAT | A good buying opportunityHi dear friends, hope you are well and welcome to the new trade setup of Kava. io (KAVA) token with Bitcoin pair.
Previously the priceline slightly moved down but recovered soon and pumped well.
Now on a 2-hr time frame, KAVA is completing a bullish BAT pattern.
Note: Above idea is for educational purpose only. It is advised to diversify and strictly follow the stop loss, and don't get stuck with trade
KAVABTCHello Crypto Lovers,
Mars Signals team wishes you high profits.
This is a 4-hour-time frame analysis for KAVABTC
In the present chart, we have R2 and R1 as are our resistance areas that represent the disability of the price to rise. And S1 is the support line which includes the support of the price at some points. Now you observe that the price is fluctuating in R1 area and we expect it to rise to the top of R1 and then by receiving confirmation candles, we consider our short position and then we predict a decline for it toward S1. In case the price fixes over R1, we suggest you to have trades up to R2 area.
Warning: This is just a suggestion and we do not guarantee profits. We advise you to analyze the chart before opening any positions.
Wish you luck

KAVA Long-Term (635%+ Potential To All-Time High)KAVA (KAVABTC) peaked hitting an All-Time High back in August 2020.
A strong correction followed and the market bottom low was set 4 months later on December 2020...
After Dec. 2020, we have a long-term consolidation phase with higher highs and higher lows. You can see this depicted on the chart.
The current low was set May 2022, together with the rest of the market, with a hammer candlestick which signals reversal when coming at support.
We have 255% potential short/mid-term.
We have over 650% potential to the ATH and even more long-term.
This is not financial advice.
Namaste.

KAVABTC is preparing for a nice jumpDear Crypto lovers,
Haven't you tighten your seat belts?
Great ALT season is coming...
It seems BTC.D is decreasing and if the BTC price allows, you'll see a fantastic ALT season.
KAVABTC is one of those pairs that you can count on if the white zone is broken validly, KAVA will see TP zones for sure.
Follow Hedgehog and share his ideas;-)

kava btc Kava is in an upward channel and has also broken the midline of the channel
In my opinion, you can enter the position on Kava, and also the target and the stoploss are specified in the image

KavabtcHi. Breakup done. Even if the btc price corrects (no crash), kava is one of the currencies that will grow. Of course I think so.like knc. We see above 200 % potential to grow.

Here is My Idea On Kava/BTCHere is My Idea on Kava. Dont Forget Stoploss. Because Bitcoin is Still not Stable
I am Not A Financial Adviser. And This Is not A Financial Advice. And All Cherts Are Just My Study. So Please Do Your Own Search before open Any Trade.
Aprox. All Crypto Currencies are Correlated to BTC . So If There is a Big Dump in BTC . All alt coin go down with it. Without Respecting any Technical Analysis
If You Like My Work Just Come and Join Me.
KAVA

#KAVA/BTC 1DAY UPDATE BY CRYPTOSANDERSWelcome to this quick
KAVA/BTC analysis.
I have tried my best to bring the best possible outcome in this chart.
Reason of trade:-KAVA/ btc is a triangle pattern create and buy the green zone
Entry:- 0.0000775,0.0000870
Target:- 800% to 1000%
Stop loss:- 0.0000650
With leverage 3x to 5x
And long term hold and good profit 😉🙂😊✈️✈️
Q:-What do you think about this?
Do you think we will see a new ATH of kava in the next quarter?
Remember:-This is not a piece of financial advice. All investment made by me is under my own risk and I am held responsible for my own profit and losses. So, do your own research before investing in this trade.
Happy trading.
Sorry for my English it is not my native language.
Do hit the like button if you like it and share your charts in the comments section.
Thank you...

KAVA to bounce against BTCProviding we don't see BTC drop lower, and if we don't see KAVA drop below the trend line drawn, it could be set to make a good bounce against BTC.

KAVA/BTC 1HOUR UPDATE Welcome to this quick KAVA/BTC analysis.
I have tried my best to bring the best possible outcome in this chart.
Reason of trade:- We can see in the chat KAVA/BTC bullish trend patterns the retesting green zone
Entry:- CMP and buy the green zone
Traget:-15% TO 20%
Stoploss:- 0.00001160
Remember:-This is not a piece of financial advice. All investment made by me is under my own risk and I am held responsible for my own profit and losses. So, do your own research before investing in this trade.
Happy trading.
Sorry for my English it is not my native language.
Do hit the like button if you like it and share your charts in the comments section.
Thank you...


KAVA - Mainnet LaunchNo investment advice!
I do this only for practicing.
All Info on the Chart.
Im using Reg-Candles on this chart, keep that in mind! (these candles are smoothed and don't showing real price)
Mainnet Launch suppose to be coming on 30 August 2021

KAVA/BTCI think KAVA is ready for breakout!
Targets are mentioned in the chart.
Please do not get greedy.
If you liked my idea, follow me for more.
#kava BTC pair is in edge of Breakout Kava BTC pair is in edge of breakout. Once breakout confirmed then next target 45sats ie 3X move from here. Get ready next week.

