[ALERT] KAVA/BTC BULLISH OWL FORMATIONKAVA is the truth. You can stake it for well over 30%. 60% of the current supply is locked up in staking right now. They'll be releasing a swap on their platform within the next two weeks. I really like their phone app Cosmostation. Expect this one to be a player in the next generation of cryptos. Start building that bag now friends while it's got a low market cap. Target for 4k by 2022.
KAVABTC trade ideas

Kava Until the end of the year PlanKava is trending sideways on its Fair Value range:
With 20% apy on staking rewards its pretty much a sure moon shot....
Cashing out of Kava about the Fair value line!!

KAVA consolidation before expansionKAVA in a quite tight range vs BTC for quite some time. Underperformed massively during the previous alt season while the rest of the Binance IEOs did very well. To me this is an interesting DeFi project that could do very well. The chart supports that view as it hasn't had that major pump before that would make me thing it is done + it has been consolidating and showing strength vs BTC when the rest of the coins are weak. If BTC dumps I don't think it will do well in USD terms and could dip vs BTC too, but long term this has high potential.


KAVABTC going longKAVA has been playing within an ascending channel for months. It is safe for me to buy it at the bottom of the channel,
If KAVA breaks the bottom on the channel then SL to be set upon retest.
If KAVA plays the range again, then I'm selling the top of the channel.
If KAVA breaks the top of the channel, then I'm re-buying the retest.

Bidding for KAVAI am working here on my perspective that best Alts to buy in a major dip (or bear market) I see are Alts that provides returns on staking or launchpads. Because eventually the more you HODL the higher the reward. And it becomes more affordable to accumulate them cheap for higher rewards.
Here comes KAVA with 90% rewards and 57% staked already.
Bid is placed at a major support, that is very ambitious but considering BTC volatility.

KAVABTC - Long - Potential 9.29%KAVABTC - Long - Potential 9.29%
Exchanges: Binance
Signal Type: Regular (Long)
Entry Zone:
0.00009629 - 0.00009972
Take-Profit Targets:
1) 0.00010358
2) 0.00010901
Stop Targets:
1) 0.00009333
Trailing Configuration:
Entry: Percentage (0.0%)
Here we see a confluence of a bull flag break out and alt volume increasing as registered by the propietary momentiment indicator at the bottom of the chart. Feel free to ask me any questions relating to my charts or ideas. As I post scalps it's often time sensitive and I try to get the information out as quickly and clearly as possible. Trading View apparently does not like this, requiring a more 'meaningful' explanation. As I have a full time Job and am simply posting the trades that I am entering at the time of entry I don't have the time (or often the bother!) to fully detail my exact thinking. Perhaps we can save me the time and effort (when trying to do other things) of publishing accompanying essays by having you guys ask any questions you may have about the set-ups and I will endeavour to explain as best as I can at times more convenient. Thank you.

KAVABTC 1HI used H1 chart for shorter term as in H4 chart we are stil recovering from the dump, so not much to see there for now. On the H1 chart it looks good, if Kava holds or retests the 0,238 fib level. THen we can go for another 10 to 20% on short term. This fib level also seems to be in the support/resist area, so pay attention there. It could also go up without retest ofcours, and then the 0 fib would be good entry.

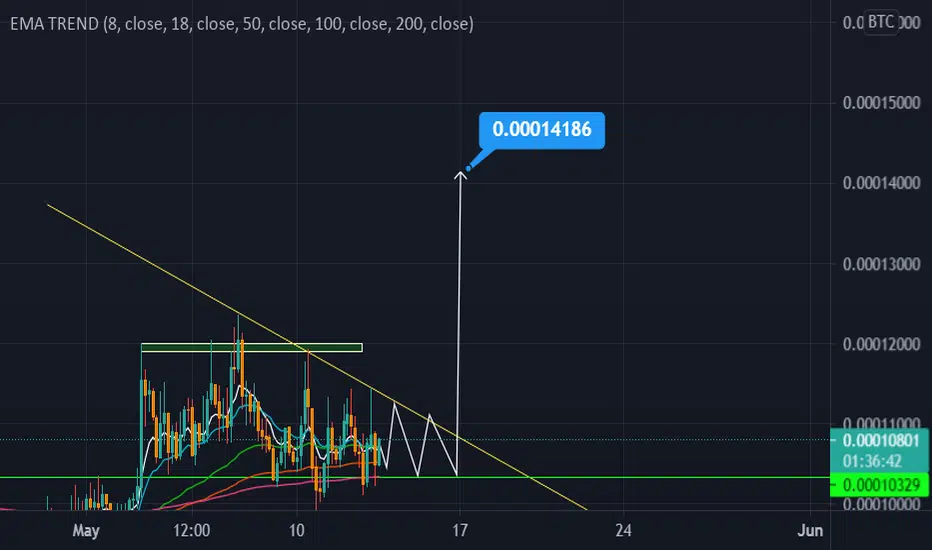
KAVA vs BTC --- LONG --- 18.05.21KAVA against Bitcoin forms a good launching pad.
The entire upward movement is accompanied by increased volumes, which is very good.
The price has nicely entrenched above the moving averages, and when we exit above the control point, we may well get momentum.
Those who see an ascending triangle or a contraction will also jump there.

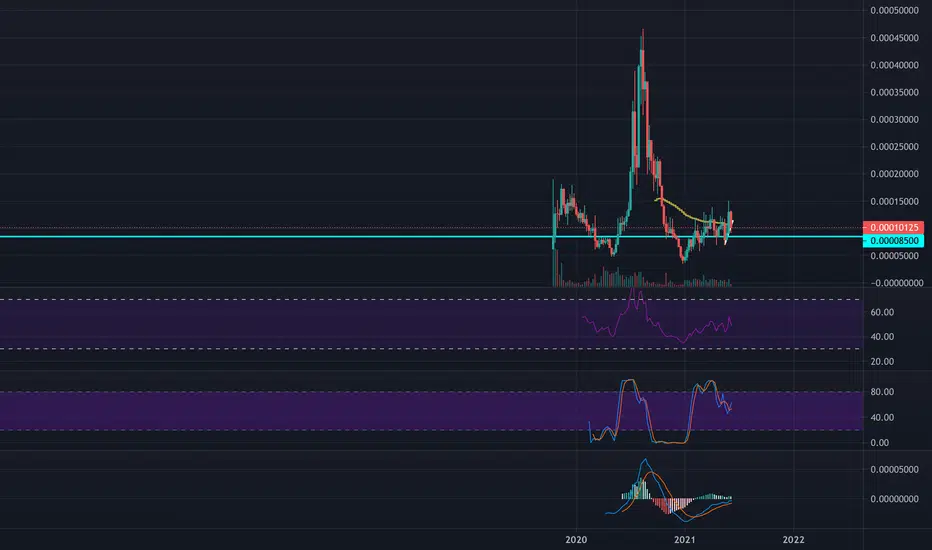
Riding the sleeping giant KAVA 💪 Very much underperforming giant here that was the star of 2020, yet a sleeping beauty in 2021.
KAVABTC may start pumping any minute, or may continue to hibernate for quite sometime as there’re yet not increase in volume, and still consolidating on the 3D 50EMA chart.
Entry level in blue
Target is 100% gain in green

KAVA/BTC - ☄️☄️ after long correctionKAVA is a very interesting coin. If you look on the chart, you will see a bit typical situations - one was before the coin went up, and another one is ended now. So, I suppose, correction is ended. I know that many traders had KAVA for a long time, and I think now is our time.
The first target is on chart, so as stop loss. Other targets (I have some more of them in mind) will be published later - no rush 😎
Will be glad to hear your opinion about this coin.

KAVABTC - Trading Setup! Not a financial advice - This is my trading diary ! It helps me think about my ideas.
Let's follow our plans to have a profitable week.
Kava is showing some strength after hitting all time low. There is a potential to grow to at least 19000 sats (Lines marked on the chart).
Since I don't like to enter pumps and chase the market. I would expect a good opportunity (pullback) to enter.
Grabbing some Kava around 9600-8800 and expecting a few months of upside.
#kava #btc #crypto #tradingidea

KAVA KAVABTC rising from the dead?This star of 2020 is a sleeping giant through 2021... yet! On the daily chart, it is almost a linear trending line. On the weekly chart we see a potential breakout. And once the breakout is confirmed KAVA has 300% potential to grow from here.
If you missed on ETH & BNB, this could be the next ticket to get you there. But hey, if you have a different point of view, tell me about it.

KAVA first lag down, then up?Rising wedge confirmed by several touchpoints. Given already high volume and RSI, potentially a retrace first before breaking $6.50-7.50

KAVA: 25k-55k-90k stsKAVA has gone through a big cycle at x10, but it looks like it's entering a new phase.
According to my expectation, KAVA can reach 25k sts & 55k sts. 90k sts is in the long term plan and I don't dare to expect it yet.

Crypto|KAVA/BTC|LongLong KAVA/BTC
Activation of the transaction only when the blue zone is fixed/broken.
The author recommends the use of anchoring fixed the blue zone, this variation is less risky.
If there is increased volatility in the market and the price is held for more than 2-3 minutes behind the activation zone after the breakdown, then the activation of the idea occurs at the prices behind the activation zone.
The idea is to work out the resistance level .
* Possible closing of a trade before reaching the take/stop zone. The author can close the deal for subjective reasons, this does not completely cancel the idea and is not a call to the same action, you can continue working out the idea according to your data, but without the support of the author.
+ Maybe right now we will go even lower, then it's okay, the idea is not activated and simply canceled.
+ ! - zone highlighted by the ellipse is a zone of increased resistance, in this area there is a possible reversal for a correction, please take this factor into account in this transaction.
The "forecast" tool is used for more noticeable display of % (for the place of the usual % scale) of the price change, I do not put the date and time of the transaction, only %.
Blue zones - activation zones.
Green zones - take zones.
Red zone - stop zone.
Working out the stop when the price returns to the level after activation + fixing in the red zone.
Orange arrow - the direction of take.
The red arrow - the direction of the stop.
SUM PNL: This parameter displays the total % of all closed ideas of the "new" format (according to the author) for this sector at the time of publication of the idea. The calculation is very "clumsy" just the sum of the profits of all the ideas, based on this indicator, you can more accurately assess the risks when working with my ideas of this sector. I present you the construction of the idea, you can use it yourself as you like based on your subjective view and risks, the calculation of the PNL indicator is carried out only on transactions that the author closed on TV in manual mode or by take.
P.S Please use RM (risk management) and MM (money management) if you decide to use my ideas, there will always be unprofitable ideas, this will definitely happen, the goal of the system is that there will be more profitable ideas at a distance.

***roberto cavalli***breakout confirmed in daily time frame and now KAVABTC seat on strong zone (R/S flip)
now i can buy this DEFI on SUPPORT (green lines) and set Stop-loss below white line (if 1D candle close below) fo TP as RED lines
i think KAVAVTC have a good R/R ratio,,,
ALWAYS DYOR,,,🥂


KAVA/BTC READY FOR 333% FLYINGKAVA/BITCOIN
Current Price = 0.00010733
All Profit Targets and stop loss have been mentioned in the above chart
Period = 30 to 60 Days
Pump Potential = 333%
Risk:Reward = 1:4.7
Technical Analysis
1. KAVA/BTC Breaks its huge falling channel
2. And now it breaking out its symmetrical traingle
3. Golden cross (50EMA Crossing up 200EMA at 1D Chart)
4. Trading above 200EMA at 4H Chart
5. Trading above 50 at RSI after a huge fall
6. Retest from All time Low
Hey Guys! you can take entry in this project for a very nice profit
Thanks & Happy Trading
