KAVA : TREND UPDATEKava shows on low time frame possible to increase.
We will follow and see the trend coming time.
Last time we see a trend where the TP takes more than any time before on all coins, I hope also for this reason with time we are going to see a new trend where we are going see a change in a long-term trend coin building that could build long-term positions for coins until now this is not the case.
Markets can be very hard, so please think about your SL on any trades you made.❤️
Market insights
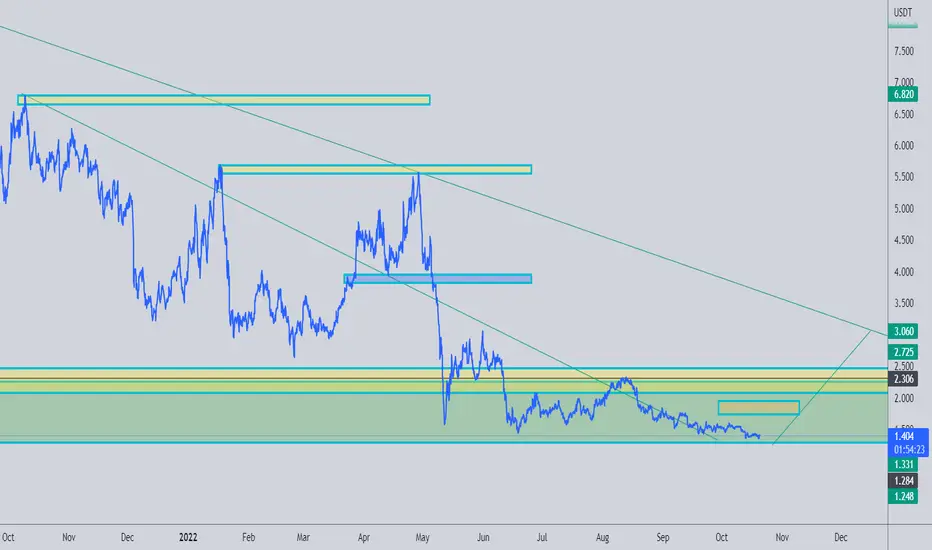
KAVAUSDT1d Bear trend, but a lot of liquidity left on top , 3 options for entry , follow the risk management and don't forget to put stop loss


KAVAUSDT❌These analyzes are just to give a better perspective for you dear ones
Do not base on buying and selling❌
Kava. io formed bullish Gartley | A good buy opportunityHi dear friends, hope you are well and welcome to the new trade setup of Kava. io (KAVA) token with US Dollar pair.
Previously there was a nice pump, but the priceline moved very close to hit the sell targets but could not reach completely.
Now on a daily time frame, KAVA has formed a bullish Gartley pattern.
Note: Above idea is for educational purpose only. It is advised to diversify and strictly follow the stop loss, and don't get stuck with trade

#KAVAUSDT 6H Chart
Price bounced off the support line and it is currently consolidating on the lower timeframes. MACD is bearish, RSI is sold and EMAs are neutral. I expect price to move up to fill the imbalance at $1.65 also taking out the liquidity present above the equal highs.

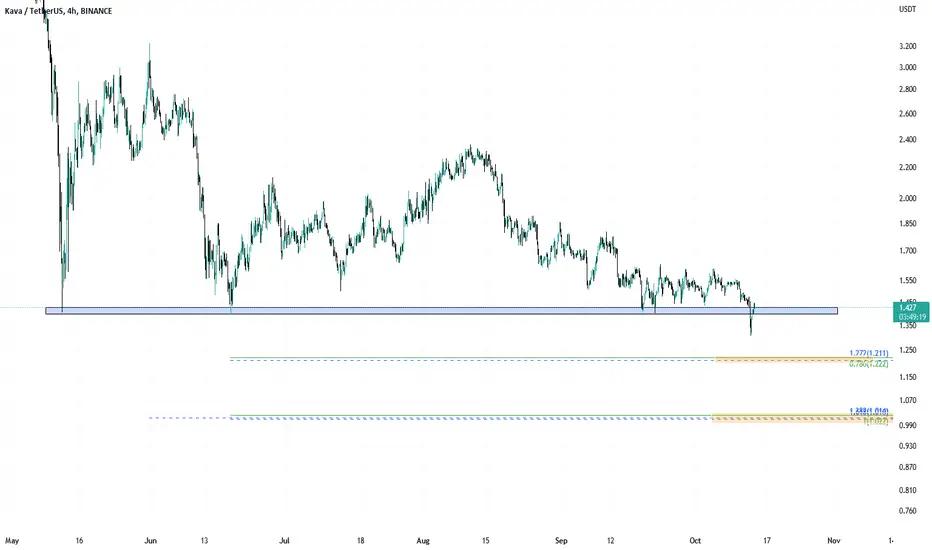
KAVAUSD ❕ lower boundary of rangeTrading volumes declined.
KAVA trades near the lower boundary of the range.
TD Sequential has formed an up reversal signal (4H TF)
I expect growth if the price of the asset holds in the range.
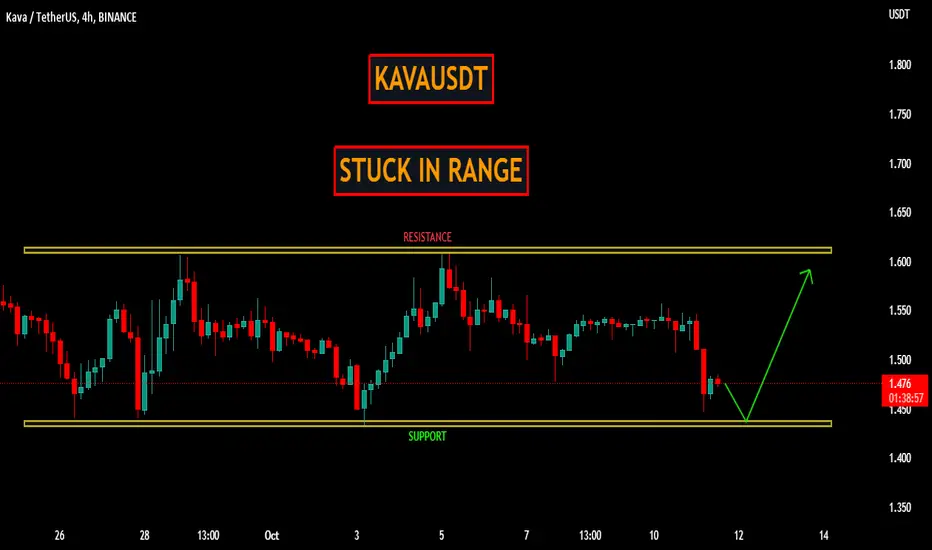
KAVAUSDT | STUCK IN RANGEKAVAUSDT is trading with in a range. The price took a beat from upper side of range and now approaching to lower side of range.
The bears are in control. The bulls can show some momentum at lower side of range. The break below will call for more bears .
Trade your levels accordingly.

KAVA/USDT Support & ResistancesDaily Technical Outlook with possible short term trading targets- 07.11.2022
⛔️Note: Please watch Pro-Technical video on Cryptosocy platform first

KAVAUSDT Daily Chart AnalysisThis chart is the correct edit of the previous KAVAUSDT chart analysis.

KAVAUSDT Daily Chart Analysis I am sure you might of heard about the Mainnet launch set to take place in the coming days (12 October 2022 if not mistaken). With this said, there is a high probability we can expect bullish price action on KAVA in the coming days regardless of the bearish sentiment in the market in the coming days.
So i will be looking to buy KAVA by the $1.51 daily Bullish Orderblock. Targeting the Liquidity Void above current price. Should price reach $2, I will be taking full profit (if there is any partials left to take).
With this said, Happy Trading Pals


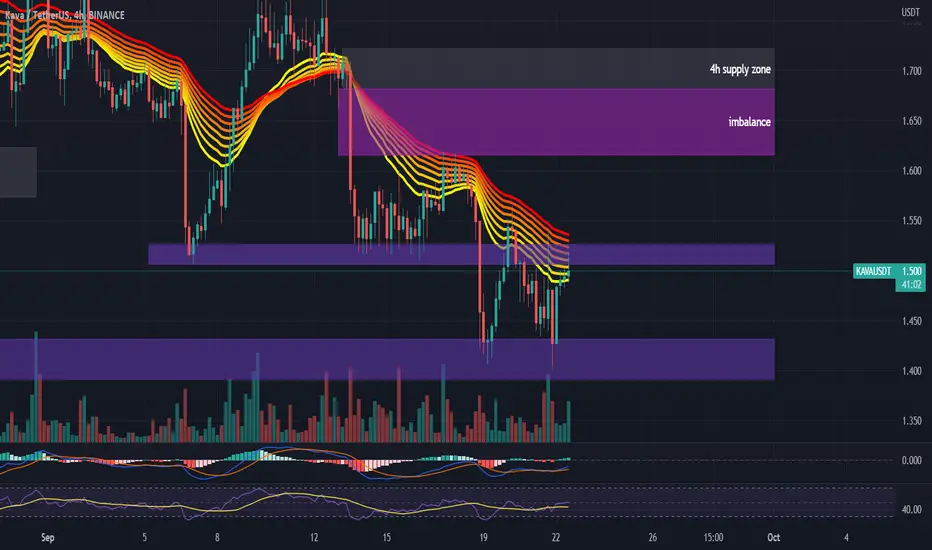
#KAVAUSDT 4H Chart
Price is still in a range between the support at $1.43 and the resistance at $1.51. MACD is not clear, RSI and EMAs are neutral. Price should reclaim $1.53 in order to aim for the imbalance at $1.65.
$KAVASitting at .886 and buy zone, event is coming in Oct. its obvious buy, we buy when there is fear in the market

KAVA/usdt 4HPrice is in a descending triangle. This pattern is completed by breaking the support area

Kava 11 coming next month and few more newsKava 11 Lunch scheduled for 15th oct or earlier,
There’s a descending triangle which has 68% chance brake to the upside

KAVA CAN MAKE A CORRECTIONYou can have a short position on this currency from the red zone. Follow capital management and stop and do not enter high leverage

KAVA LEND A push above 1.60 can potentially get it to $10-$20.
When it makes that upside down U pattern, it's cause it tries to stay over sold.

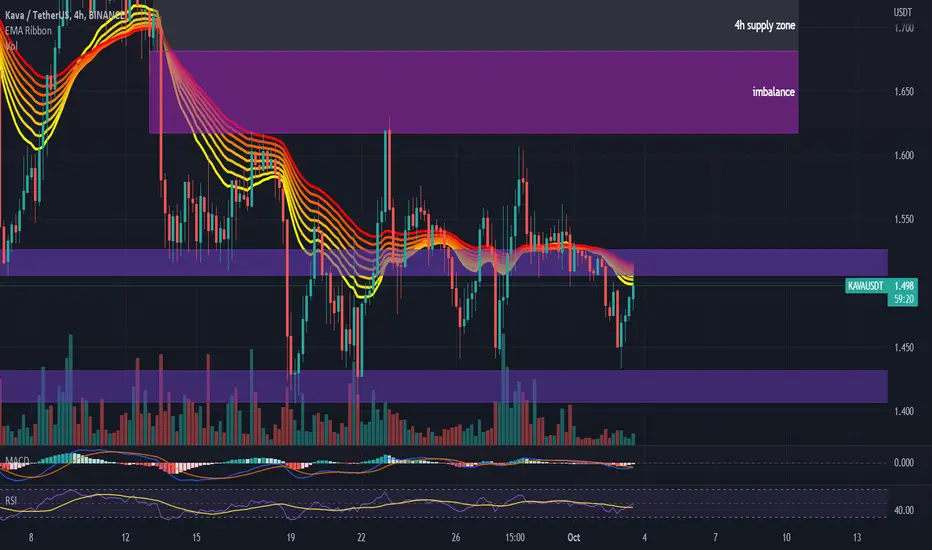
#KAVAUSDT 4H Chart
Price is currently consolidating between the support at $1.4 and the resistance at $1.51. MACD is not clear, RSI is sold and EMAs are bearish. Price needs to close above $1.53 in order to move up and fill the imbalance at $1.65.
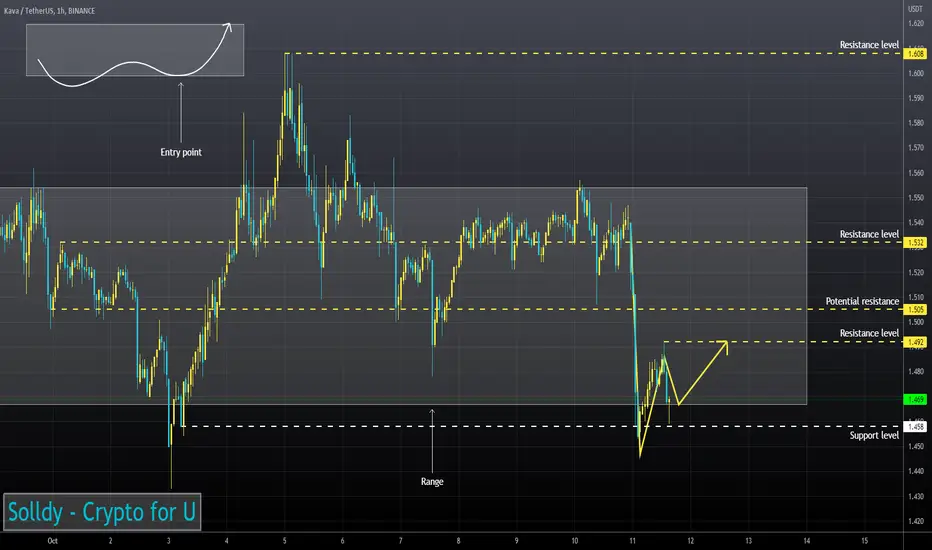
Long ScalpGood entry here for long scalp with tp on 1.63 and next tp on 1.66 - 1.69. Huge volume is coming again soon be ready we could pump really soon. For more signals like and follow

KAVA ABCDKava forming a ABCD at pattern completion zone and is now trying to backtest the demand line and push up to 1.60 again

