#KAVA/USDT#KAVA
The price is moving in a 1-hour bearish channel and sticking to it well
The price rebounded well from the lower border of its neck at the green support level of 0.660
We have a tendency to stabilize above the Moving Average 100
We have oversold RSI to support the upside
Entry price is 0670
The first target is 0.7180
The second target is 0.7435
The third goal is 0.7723
Market insights

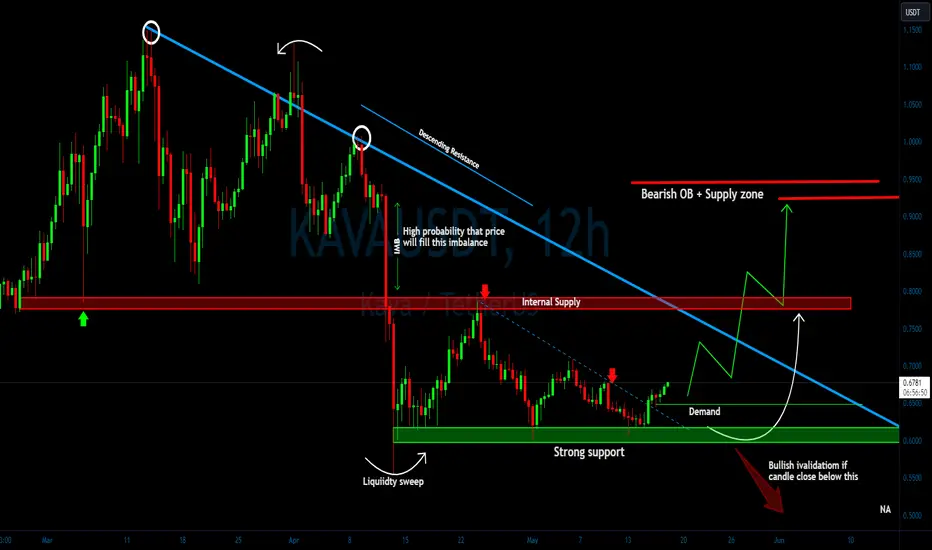
KAVA/USDT upward trajectory from demand? 👀🚀KAVA analysis💎 Paradisers, take note as #KAVAUSDT is currently making a noteworthy move, trading within a demand zone that significantly raises the likelihood of a bullish trend.
💎 Previously, we've observed #KAVA consistently respecting descending resistance. Currently, as the price regains momentum at the demand level of $0.6489, there's a high chance that it could overcome the descending resistance and tackle the noted Bearish Order Block.
💎 However, considering the inherent volatility of the market, if SEED_DONKEYDAN_MARKET_CAP:KAVA fails to maintain its momentum and falls below the demand level at $0.6489, this could indicate a softening of the bullish stance, potentially leading to a substantial price drop.
💎Should this occur, we will shift to plan B: we may witness a bullish rebound from the lower, substantial support level at $0.5963, although breaking below this level could trigger significant downward movements.
MyCryptoParadise
iFeel the success🌴
"KAVA" Extended wave next...Hello, friends. Nice to meet you
After breaking the RISING WEDGE down,
It shows a very strong extended wave.
If the upper line of this extended wave is broken upward, it is likely to rise to the recent high.

$KAVA may skip the 2024 Bull RunBINANCE:KAVAUSDT , 1d
After reaching failing to break it’s 2024 high around the $1.15 area, price created a lower high and broke below the 200SMA forming a lower low. This creates a bearish sentiment for KAVA.
The downward trendline aligns with the stiff resistance created by 200SMA and previous support turned resistance. This is a key level where bears will look for shorting opportunities. Keep an eye on the charts and wait for price reaction to initiate a trade.
The only indicator making a bullish case for KAVA is the bullish MACD crossover but price has to ultimately breakout of the downward trendline and 200SMA and remain above it to bring back the bullish sentiment.
As always, “anything can happen” so let the market unfold and react accordingly. #DYOR

Technical Analysis Reveals Explosive Gain PotentialWatch out, crypto-enthusiasts! Our latest technical analysis reveals that KAVA could be on the verge of a meteoric rise. The study of the graph demonstrates a remarkable compression zone, often precursor to increased volatility and imminent directional movement.
The recent consolidation in the support area, combined with a decline in volumes, suggests a discreet accumulation by informed actors. Such a price squeeze is a classic prelude to a powerful boost. The key indicator here is the underlying resistance. A breakthrough beyond this border could catalyze an impressive rally, with a target projection indicating a potential increase of 145.74%, as denoted by the sky blue rectangle.
This setup is not only a signal for traders, but a call to anyone looking to capitalize on the dynamic opportunities offered by cryptos like KAVA. For sophisticated technical analysis, insightful forecasts and real-time trading advice, be sure to follow me. Together, let’s discover the gems of the crypto market

Last post didnt have full screenshotIdk why that happened, just take a look at the previous post, should be linked to this

Last trendline remains, lets share our thoughts :)You can probably see the image
200ema broke,
Some trendlines broke (pink for closer and blue for longer trendlines)
Now so far i am expecting a rebounce (not immediately) from lowest trendline
Unless ofc iran/israel stuff worsens, we may go even low
Anyway, let me know if anything can be improved in the chart

KAVA🔔When will she wake up?🔔Looks like everything is ready for growth. We are waiting for a miracle. I'm already tired of holding futures)

$KAVA Breakout Play🔨 Key Resistance: 0.9$ - 1.16$
📍 Buy Zone: 0.7$ - 0.8$
🎯 Target 1 - $1.16
🎯 Target 2 - $1.39
🎯 Target 3 - $1.6
🎯 Target 4 - $2.3

KAVA on fire!Hello friends,
A coin that's not even 50% from the bottom created 6 months ago, deserves attention.
Logging this one and holding it for a little while until these targets are reached.
Trade thirsty my friends.

KAVA/USDT looking bullish, potential 300%++Accumulation zone given in the chart
accumulate under $0.98
TP1 : $1.5274
TP2 : $2.1933
TP3 : $2.6046
TP4 : $3.2900
TP5 : $3.6817
TP4 : $3.9951
TP5 : $4.7393
SL : 10% below average buying

KAVA USDT - BullishLine of Support= $0.92
Line of Resistance= $1.14
Major Resistance= $1.30
Target= $1.51
KAVA has daily candles closed above the current support level, resistance will be broken very soon this month. KAVA will push through the major resistance level without hesitation!

Alikze »» KAVA | The trigger pullback is brokenIn time W1, after exiting the density and pulling back to the dynamic trigger, it will now have the ability to grow up to the red box area, and if it fails, it will succeed in continuing the upward path to the specified goals.
»»»«««»»»«««»»»«««
Please support this idea with a LIKE and COMMENT if you find it useful and Click "Follow" on our profile if you'd like these trade ideas delivered straight to your email in the future.
Thanks for your continued support.
Sincerely.❤️

$KAVA #KavaChain Trading IdeaKAVA/USD (KavaChain) formed a wedge/triangle pattern and now it's struggling to break through ($1.05-1.15) because it faces a massive resistance (key level). Full send after a breakout and the next potential magnet target could be around $2.35.
Remember, all the Altcoins will do well if the Bitcoin continues to move to the upside. DYOR.

Kava is primed for a jumpMy main target is the 786
Targets higher are at the imbalance levels above.
Short term target is the value area high of the range

$KAVA - Long Trade (Accumulation > Send)SEED_DONKEYDAN_MARKET_CAP:KAVA - Still in accumulation.
Nice set-up here, similar to how Total3 looked.
Lagging.

[KAVAUSDT]- Accumulation phase looks cheerful in 3d chart as it's in accumulation phase and obviously there is many attempt to breakout the 0.236 fib res.
extermly bullish if get out from the accumulation.
dont forget to support us with ur like comment and follow for more ideas,updates🎯

KAVA SWING TRADE OPPORTUNITYI bought a bag of KAVA here for SWING trade.
It looks like an impulsive wave will soon commence. BIG move soon.
TP 1: 2.2775
TP 2: 5.32
TP 3: 9.2
Leave 15% for moon bag and stop loss at break even once TP 1 gets triggered.


KAVA /USDT bullish horizons from key demand? 👀 🚀KAVA analysis💎 Paradisers, set your sights on #KAVAUSDT! An intriguing pattern has emerged, indicating it's in a prime spot for a potential bullish surge.
💎 #KAVA is on an upward trajectory within an ascending channel, having impressively crossed a significant supply point at $0.8455. With the price now nearing a critical demand level, keeping up the pace could pave the way for a strong bullish push into higher territory.
💎 If the drive behind SEED_DONKEYDAN_MARKET_CAP:KAVA starts to fade, we're poised to seize a potential uplift from the key demand level at $0.7972. However, a drop below this essential marker could signal a move into bearish waters.
💎 As always, make sure to navigate with savvy trading strategies and secure your positions with appropriate stop-loss orders! Keep an eye on the evolving market landscape and stay tuned for further updates.

KAVA LOW RISK HIGH REWARD?This are one of those which are still in hibernation slowly creeping to the top, not a bad one to look into and hold some in the bag, gonna watch as it unfolds ☺️ trade safe

#KAVA/USDT LONG#KAVA
The downtrend of the reversal flag has been broken
At the same time, the EMA 100 was breached higher
We have a large reversal pattern and the price looks set to break it
The price is expected to trade in an upward wave with price corrections
Current price 0.945
The first goal is 1.180
The second goal is 1.411

finally kava heating up
Seems Like kava Has Already Bottomed Out And Finally Preparing For Solid Recovery Currently testing Descending Trendline+ Crucial Horizontal Resistance Once Both Got Cleared Massive Bullish Rally Can Start Expecting 300-350% Bullish Wave Incase Of Successful Breakout
