LAYERUSDT Forming Falling WedgeLAYERUSDT is forming a clear falling wedge pattern, a classic bullish reversal signal that often indicates an upcoming breakout. The price has been consolidating within a narrowing range, suggesting that selling pressure is weakening while buyers are beginning to regain control. With consistent volume confirming accumulation at lower levels, the setup hints at a potential bullish breakout soon. The projected move could lead to an impressive gain of around 140% to 150% once the price breaks above the wedge resistance.
This falling wedge pattern is typically seen at the end of downtrends or corrective phases, and it represents a potential shift in market sentiment from bearish to bullish. Traders closely watching LAYERUSDT are noting the strengthening momentum as it nears a breakout zone. The good trading volume adds confidence to this pattern, showing that market participants are positioning early in anticipation of a reversal.
Investors’ growing interest in LAYERUSDT reflects rising confidence in the project’s long-term fundamentals and current technical strength. If the breakout confirms with sustained volume, this could mark the start of a fresh bullish leg. Traders might find this a valuable setup for medium-term gains, especially as the wedge pattern completes and buying momentum accelerates.
✅ Show your support by hitting the like button and
✅ Leaving a comment below! (What is your opinion about this Coin?)
Your feedback and engagement keep me inspired to share more insightful market analysis with you!
Market insights

LAYER/USDT-Ready LAYER/USDT appears to have completed the final stage of a liquidity sweep, where weak hands were shaken out below key support. This behavior is commonly seen at the end of corrective cycles, setting the stage for a strong directional move.

LAYER LOOKING FOR MASSIVE REVERSAL+Layer Looking for a Potential Trend Reversal with Bullish Technicals on HTF, Use Proper Risk Management

LAYER Update🚨📊 LAYER Update
LAYER has just broken out above the red resistance zone 🔴🚀
with strong, big bullish candles, showing powerful buyer momentum.
With this clean breakout,
LAYER could continue moving up toward the green line targets 🟩🎯
as long as price holds above the old resistance (now turned support).
Key points:
🔴 Red resistance broken
🚀 Strong bullish breakout candles
🟩 Next targets = green line levels
Support flip increases bullish continuation chances

LAYERUSDT Forming Falling WedgeLAYERUSDT is forming a clear falling wedge pattern on the daily chart, a classic bullish reversal signal that often indicates an upcoming breakout in the high-performance Solana ecosystem of late 2025. The price has been consolidating within a narrowing range around $0.23, suggesting that selling pressure is weakening while buyers are beginning to regain control through higher lows amid the recent 37% surge from oversold depths. With good trading volume exploding to over $288 million in the last 24 hours—dominated by Binance's LAYER/USDT pair—the setup hints at a potential bullish breakout soon, especially as RSI rebounds from oversold territory near 40 and the wedge nears its apex. The projected move could lead to an impressive gain of 60% to 70%+ once the price breaks above the wedge resistance near $0.27, targeting levels up to $0.39 in the near-term rally.
This falling wedge pattern is typically seen at the end of downtrends or corrective phases, and it represents a potential shift in market sentiment from bearish to bullish as LAYERUSDT stabilizes post its October lows at $0.085. Traders closely watching LAYERUSDT are noting the strengthening momentum from Solayer's InfiniSVM architecture, which leverages RDMA and InfiniBand for 1MM+ TPS and near-zero latency, fueling real traction in decentralized high-frequency trading. The good trading volume adds confidence to this pattern, showing that market participants are positioning early in anticipation of a reversal, with open interest spiking 60% and over 1.8 million trades signaling whale accumulation.
Investors’ growing interest in LAYERUSDT reflects rising confidence in the project’s long-term fundamentals, like the hardware-accelerated network's multi-execution model and integrations targeting $79 million market cap growth. If the breakout confirms with sustained volume, this could mark the start of a fresh bullish leg, amplified by predictions eyeing $3+ highs in 2025's scaling boom. Traders might find this a valuable setup for medium-term gains, especially as the wedge pattern completes and buying momentum accelerates toward $0.50+ in the Solana DeFi surge.
✅ Show your support by hitting the like button and ✅ Leaving a comment below! (What is You opinion about this Coin) Your feedback and engagement keep me inspired to share more insightful market analysis with you!

#LAYER/USDT Forming Falling Wedge#LAYER
The price is moving within an ascending channel on the 1-hour timeframe and is adhering to it well. It is poised to break out strongly and retest the channel.
We have a downtrend line on the RSI indicator that is about to break and retest, which supports the upward move.
There is a key support zone in green at 0.2187, representing a strong support point.
We have a trend of consolidation above the 100-period moving average.
Entry price: 0.2240
First target: 0.2380
Second target: 0.2544
Third target: 0.2753
Don't forget a simple money management rule:
Place your stop-loss order below the green support zone.
Once you reach the first target, save some money and then change your stop-loss order to an entry order.
For any questions, please leave a comment.
Thank you.

formed a rounded bottomAfter a prolonged downtrend, price has formed a rounded bottom and is now showing signs of bullish accumulation. Multiple higher lows indicate that buyers are gradually stepping in. Price is currently retesting a minor support level with steady volume, creating a potential opportunity for a continuation move toward the next resistance. My entry is based on this bullish structure, with a stop below the recent swing low and a target aligned with the upper resistance zone.

LAYERUSDT Forming Falling WedgeLAYERUSDT is forming a clear falling wedge pattern on the daily chart, a classic bullish reversal signal that often indicates an upcoming breakout in the high-performance Solana ecosystem of late 2025. The price has been consolidating within a narrowing range around $0.23, suggesting that selling pressure is weakening while buyers are beginning to regain control through higher lows amid the recent 37% surge from oversold depths. With good trading volume exploding to over $288 million in the last 24 hours—dominated by Binance's LAYER/USDT pair—the setup hints at a potential bullish breakout soon, especially as RSI rebounds from oversold territory near 40 and the wedge nears its apex. The projected move could lead to an impressive gain of 60% to 70%+ once the price breaks above the wedge resistance near $0.27, targeting levels up to $0.39 in the near-term rally.
This falling wedge pattern is typically seen at the end of downtrends or corrective phases, and it represents a potential shift in market sentiment from bearish to bullish as LAYERUSDT stabilizes post its October lows at $0.085. Traders closely watching LAYERUSDT are noting the strengthening momentum from Solayer's InfiniSVM architecture, which leverages RDMA and InfiniBand for 1MM+ TPS and near-zero latency, fueling real traction in decentralized high-frequency trading. The good trading volume adds confidence to this pattern, showing that market participants are positioning early in anticipation of a reversal, with open interest spiking 60% and over 1.8 million trades signaling whale accumulation.
Investors’ growing interest in LAYERUSDT reflects rising confidence in the project’s long-term fundamentals, like the hardware-accelerated network's multi-execution model and integrations targeting $79 million market cap growth. If the breakout confirms with sustained volume, this could mark the start of a fresh bullish leg, amplified by predictions eyeing $3+ highs in 2025's scaling boom. Traders might find this a valuable setup for medium-term gains, especially as the wedge pattern completes and buying momentum accelerates toward $0.50+ in the Solana DeFi surge.
✅ Show your support by hitting the like button and ✅ Leaving a comment below! (What is You opinion about this Coin) Your feedback and engagement keep me inspired to share more insightful market analysis with you!

LAYERUSDT 1D#LAYER is attempting to break above the falling wedge pattern on the daily chart, but it’s also running into a resistance cluster that includes the Ichimoku cloud and the daily SMA50. Because of this, there’s a chance it may pull back into the wedge and retest the support. Consider buying a small bag here and near the support zone. If price breaks above the entire resistance cluster, the potential upside targets are:
🎯 $0.2913
🎯 $0.3599
🎯 $0.4153
🎯 $0.4707
🎯 $0.5496
🎯 $0.6501
⚠️ Always remember to use a tight stop-loss and maintain proper risk management.

LAYER 0.24 finding under loved projectswhen ur down
and you went lower
with no reason
its a made up crash
it shall have made up sytories of great news as weel
NFA
just making sexy guess guys
do your own ressearc
or send me some JELLYJELLY tokens for love and kisses

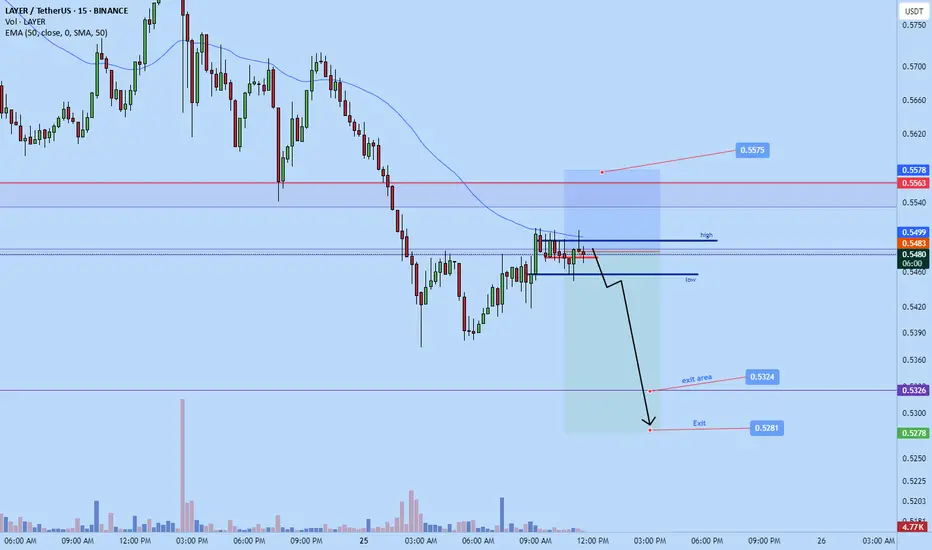
Layerusdt short down to $0.5324 areaLayer short.
sl: 0.5575
Tp area: 0.5324
Roughly 1.7-2RR
Follow on x to learn more
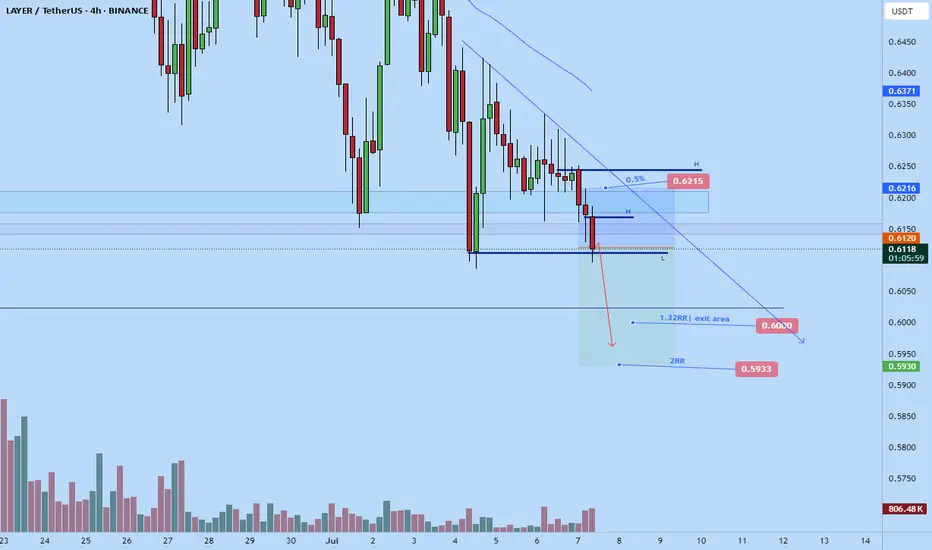
Layer scalp short to $.6Stop: $0.6215
Tp area: $0.6
Will monitor for potential 2RR exit at $0.5933
Trend is very bearish on Layer and with tariffs there's a good probability it will stick. Saw it a bit late though.
Sol layer short to $0.62Recently opened a short position on sol layer.
Aiming for $0.62 price target.
Roughly 2 RR.
STop: $0.64

Sol layer long to $0.6875Just now opened up a long position on sol layer. Targeting $0.6875
I anticipate that the market will try to make a new on the 1hr tf, which is around previous day wick high . Considering that we rejecting from support already I think its quite probable based on my DTT analysis.
Stop should be sufficient at $0.6535
market could push further but am just aiming to get in and out quickly. Let's see how it goes. Regardless how it goes, I think its a solid setup

Solayer, Big Rewards For The Patient, 630% Target ExposedYou could say that this is not an easy one because of Bitcoin's current situation. When Bitcoin is shaky, doubtful, the entire market becomes doubtful and hard to approach, but still, we buy the bottom/support and sell when prices are up.
Solayer produced an uncharacteristic rise previously, it can always repeat a strange behavior, it can detach from the market and move in its own way. There are always pairs that can do anything and do move strangely but also, market conditions can be something today and something different the next day. We shouldn't ignore a good opportunity based on assumptions or something that is not confirmed.
Solayer produced a double-bottom and the volume is good now with the current bounce.
There is also an ending diagonal (blue), which is a reversal pattern.
Say the short-term goes awry and Solayer continues lower, it hits a lower low; how long is it going to take for a reversal to happen? Once we hit bottom, if the bottom is not hit it isn't likely to be far away.
Say things go very bad and we get another low; how long will it take, two months?
That's the beauty of Cryptocurrency trading. Say it does go bad and instead of a reversal we get lower and it takes two months for prices to go up. Guess what? Profits potential would still go beyond 200% within 3 months. That's pretty good for sure no matter how you slice it, think long-term.
On the other hand, one can easy hit the first target for 130% or more within one month, short-term. If it doesn't work, try again, but you can't go wrong if you buy and wait. Notice the difference between current price and the all-time high... It is a nice chart setup, a nice trading opportunity; easy money, depending on your strategy, your thinking, your mindset.
If you are in too much a hurry, ok, you can secure a loss. If you have patience, you can end up with another win in the coming months. It is a great situation. Get ten like these and you set up yourself for success in the short-term. Once your targets hit, can take 3 months or 3 days, find a new set of charts. New opportunities are available every single day.
Take the time to take action. Take the time to choose; choose wisely, and the market will reward you with tons of profits; Crypto is here to stay.
Thank you for reading.
Your support is appreciated.
Namaste.

LAYERUSDTBullish trend continuation expectation
either take entry on break of HH
or take entry on fib 0.382 and put SL 0.6013

Sol layerOpened a short on Sol layer a while ago. Market likely to fall back towards support around $0.67 soon.
An aggressive break down from here is likely today in order to make new lows.
Stop: $0.75
Tp: $0.67
3RR
Time sensitive

Solayer 144% —The Fed Will Lower Interest Rates June 2025Endless opportunities this market has to offer. Even the same opportunity turns up over and over, again and again. If you missed it once, you can comeback and the market will opens its door for you to trade.
Easy win, easy buy, easy profits, easy hold, easy trade.
Solayer went even lower and matched the early March 2025 low prices. It can continue even lower before reversing so watch-out. It can also start moving right away. The trick is to buy and hold, not worrying about the short-term.
If the market wants to move lower, that's ok, we wait. If it moves higher, we have a win (green), this is also good, we wait for our target to hit to sell. You can use the target on the chart or you can aim higher is up to you.
If prices move lower, you can use a stop-loss or quit at a loss. No bueno.
If the market moves lower, it will recover because we are bullish now-long-term.
If the market was bearish, the overall market and cycle, then we wouldn't be talking about holding and long-term growth, we would be talking about taking profits and going home.
The Fed will lower interest rates later this month. This will create a major boom; Crypto is going up. You can more than double your capital with this pair. Endless opportunities the Cryptocurrency market has to offer.
Thank you for reading.
Namaste.

Layer dump not overJust recently opened a short position on later. It doesn't appear to me that the dump is over as the market keeps trending down making , the bears are still in strong and market broke pass prior levels that could have been used as a demand area. The fact that they broke shows weak demand so market will likely all lower until it reaches and area where its favorable for a lot of demand to come in.
That price is $0.7350- conservative price.
Main target is $0.67 area
Stop: $0.8 or higher.

$LAYER/USDT Technical Breakdown – April 11, 2025📈 $LAYER/USDT Technical Breakdown – April 11, 2025
We’re seeing a strong bullish structure forming on $LAYER as price breaks out of a prolonged accumulation phase and heads toward key resistance.
🔍 Chart Overview
Price Action: Price is currently trading at 1.9320 USDT, breaking out of the previous range highs around 1.70 USDT.
Structure: Higher lows and steady volume buildup signal healthy momentum. A textbook breakout scenario.
Support Zones:
First key support: 1.70 - 1.68 USDT (previous resistance, now turned support)
Major support: 1.35 - 1.40 USDT (trendline + previous demand area)
📌 Entry Ideas
Breakout Retest Entry: Watch for a potential pullback toward 1.70 USDT. If it holds, this could be a solid entry zone for continuation.
Aggressive Entry: Some traders might enter on continuation above 1.95 USDT with strong volume confirmation.
🎯 Upside Targets
Target 1: 2.20 USDT – Closest resistance, marked by the upper consolidation zone from the chart.
Target 2: 2.50 USDT – Mid-term level if bullish momentum continues.
Target 3: 3.00+ USDT – Psychological round number and historical high zone.
🧠 Trade Management
Stop-loss: Below 1.65 USDT, in case of failed breakout and close back inside range.
Risk Management: Position sizing according to risk/reward. R:R of at least 2:1 from retest entry.
📊 RSI Note
RSI is currently hovering around 70, showing strong momentum, but entering overbought territory – monitor for divergence or weakness on lower timeframes.
enjoy and good trading!

LAYER/USDTKey Level Zone: 1.0280 - 1.0350
HMT v8.1 detected. The setup looks promising, supported by a previous upward/downward trend with increasing volume and momentum, presenting an excellent reward-to-risk opportunity.
HMT (High Momentum Trending):
HMT is based on trend, momentum, volume, and market structure across multiple timeframes. It highlights setups with strong potential for upward movement and higher rewards.
Whenever I spot a signal for my own trading, I’ll share it. Please note that conducting a comprehensive analysis on a single timeframe chart can be quite challenging and sometimes confusing. I appreciate your understanding of the effort involved.
Important Note :
Role of Key Levels:
- These zones are critical for analyzing price trends. If the key level zone holds, the price may continue trending in the expected direction. However, momentum may increase or decrease based on subsequent patterns.
- Breakouts: If the key level zone breaks, it signals a stop-out. For reversal traders, this presents an opportunity to consider switching direction, as the price often retests these zones, which may act as strong support-turned-resistance (or vice versa).
My Trading Rules
Risk Management
- Maximum risk per trade: 2.5%.
- Leverage: 5x.
Exit Strategy
Profit-Taking:
- Sell at least 70% on the 3rd wave up (LTF Wave 5).
- Typically, sell 50% during a high-volume spike.
- Adjust stop-loss to breakeven once the trade achieves a 1.5:1 reward-to-risk ratio.
- If the market shows signs of losing momentum or divergence, ill will exit at breakeven.
The market is highly dynamic and constantly changing. HMT signals and target profit (TP) levels are based on the current price and movement, but market conditions can shift instantly, so it is crucial to remain adaptable and follow the market's movement.
If you find this signal/analysis meaningful, kindly like and share it.
Thank you for your support~
Sharing this with love!
HMT v2.0:
- Major update to the Momentum indicator
- Reduced false signals from inaccurate momentum detection
- New screener with improved accuracy and fewer signals
HMT v3.0:
- Added liquidity factor to enhance trend continuation
- Improved potential for momentum-based plays
- Increased winning probability by reducing entries during peaks
HMT v3.1:
- Enhanced entry confirmation for improved reward-to-risk ratios
HMT v4.0:
- Incorporated buying and selling pressure in lower timeframes to enhance the probability of trending moves while optimizing entry timing and scaling
HMT v4.1:
- Enhanced take-profit (TP) target by incorporating market structure analysis
HMT v5 :
Date: 23/01/2025
- Refined wave analysis for trending conditions
- Incorporated lower timeframe (LTF) momentum to strengthen trend reliability
- Re-aligned and re-balanced entry conditions for improved accuracy
HMT v6 :
Date : 15/02/2025
- Integrated strong accumulation activity into in-depth wave analysis
HMT v7 :
Date : 20/03/2025
- Refined wave analysis along with accumulation and market sentiment
HMT v8 :
Date : 16/04/2025
- Fully restructured strategy logic
HMT v8.1 :
Date : 18/04/2025
- Refined Take Profit (TP) logic to be more conservative for improved win consistency

Got Correction? Solayer Buy Opportunity (PP: ~600%)A correction is not the end. Remember, when prices drop in a bull market this truly becomes a buy opportunity...
Good evening my fellow Cryptocurrency trader, I hope you are having a very nice day.
Here LAYERUSDT went through a strong correction, a fast correction but that does not matter, it is actually good news because prices are back to baseline and low prices means a new opportunity to trade.
Prices are back to the level visited in mid-March and the correction was more than 70% strong. What does this means? This means that the correction is over and there is room for a new wave of growth.
We have a volume breakout and support is found at a higher low.
Keeping it simple, Solayer is ready to grow.
Namaste.

$LAYER Short-term OutlookBINANCE:LAYERUSDT | 6h
Showing signs of recovery after the sharp drop.
Key support: $0.90–$1 — needs to hold this zone
Immediate resistance: $1.26 — a break above could trigger a move to $1.60 to $2 (short-term target)
If $1 holds, short-term upside remains likely
