#LDO/USDT — Critical Retest at Demand Zone vs Long-Term Downt#LDO
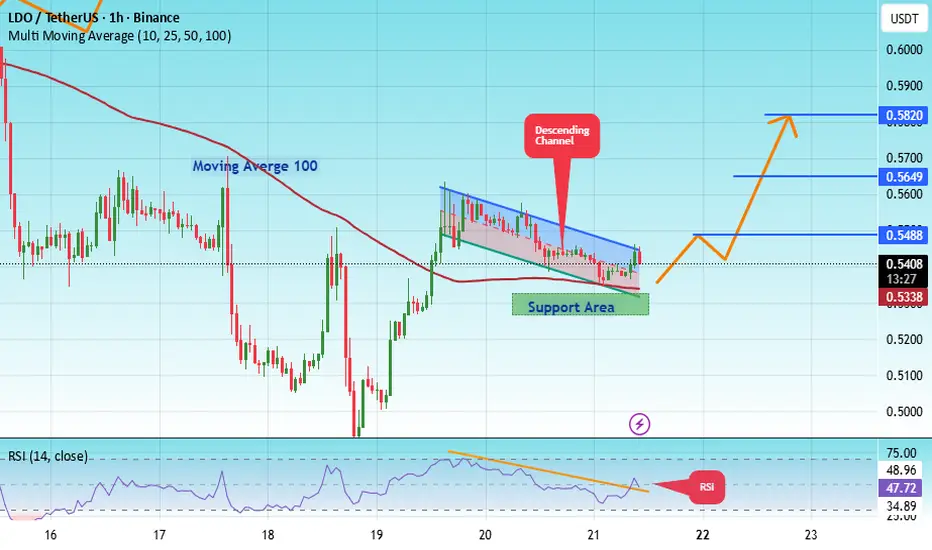
The price is moving in a descending channel on the 1-hour timeframe. It has reached the lower boundary and is heading towards breaking above it, with a retest of the upper boundary expected.
We have a downtrend on the RSI indicator, which has reached near the lower boundary, and an upward rebound is expected.
There is a key support zone in green at 0.5300. The price has bounced from this level multiple times and is expected to bounce again.
We have a trend towards consolidation above the 100-period moving average, as we are moving close to it, which supports the upward movement.
Entry price: 0.5412
First target: 0.5488
Second target: 0.5650
Third target: 0.5820
Don't forget a simple principle: money management.
Place your stop-loss order below the green support zone.
For any questions, please leave a comment.
Thank you.
Market insights
#LDO/USDT — Critical Retest at Demand Zone vs Long-Term Downtr#LDO
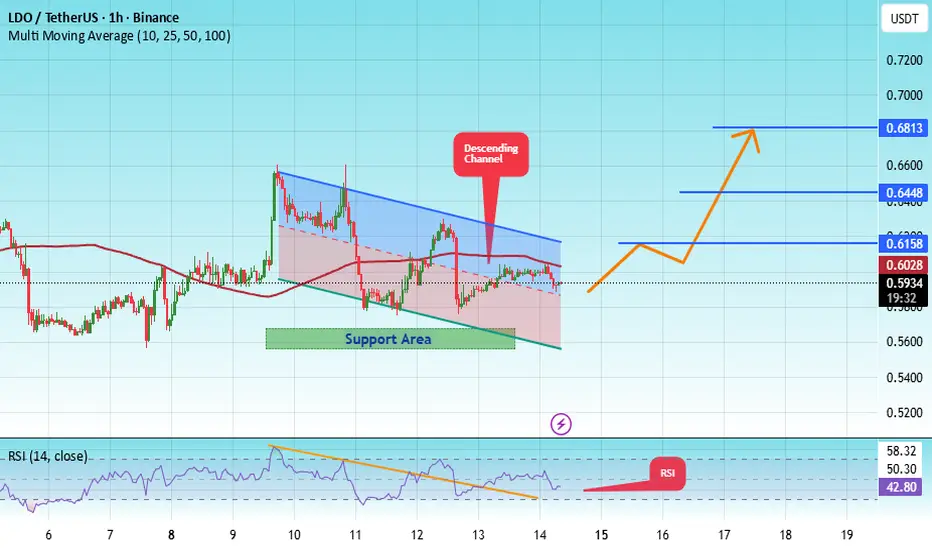
The price is moving in a descending channel on the 1-hour timeframe. It has reached the lower boundary and is heading towards breaking above it, with a retest of the upper boundary expected.
We have a downtrend on the RSI indicator, which has reached near the lower boundary, and an upward rebound is expected.
There is a key support zone in green at 0.5625. The price has bounced from this zone multiple times and is expected to bounce again.
We have a trend towards stability above the 100-period moving average, as we are moving close to it, which supports the upward movement.
Entry price: 0.5936
First target: 0.6160
Second target: 0.6448
Third target: 0.6813
Don't forget a simple principle: money management.
Place your stop-loss order below the support zone in green.
For any questions, please leave a comment.
Thank you.
LDO Forming Higher Low Under Daily Resistance🔥 Welcome To FireHoseReel !
Let’s dive into Lido DAO (LDO) analysis.
⛳️ LDO Fundamental Overview
Lido DAO (LDO) is a leading liquid-staking governance token ranked around #84 on CoinMarketCap, enabling ETH staking rewards while keeping assets liquid and driving DeFi participation.
👀 LDO 4H Overview
LDO bounced from a monthly support level and moved higher, forming a higher low at $0.5267. Price is now trading just below its daily resistance at $0.5591.
📊 Volume Analysis
After testing the daily resistance, LDO experienced declining volume and selling pressure. Following the higher low formation, buyers stepped in again. If buying volume continues, the $0.5591 resistance could be broken.
✍️ LDO Trading Scenarios
🟢 Long Scenario:
A breakout above $0.5591 with increasing buy volume, along with RSI breaking above 56.58, increases the probability of a breakout and can trigger a long setup.
🔴 Short Scenario:
A breakdown below the current low at $0.5267, combined with rising sell volume and RSI dropping below 41.94, can activate a short setup.
🧠 Protect your capital first. No setup is worth blowing your account. If risk isn’t controlled, profit means nothing. Trade with rules, not emotions.

#LDO/USDT — Critical Retest at Demand Zone vs Long-Term Downtr#LDO
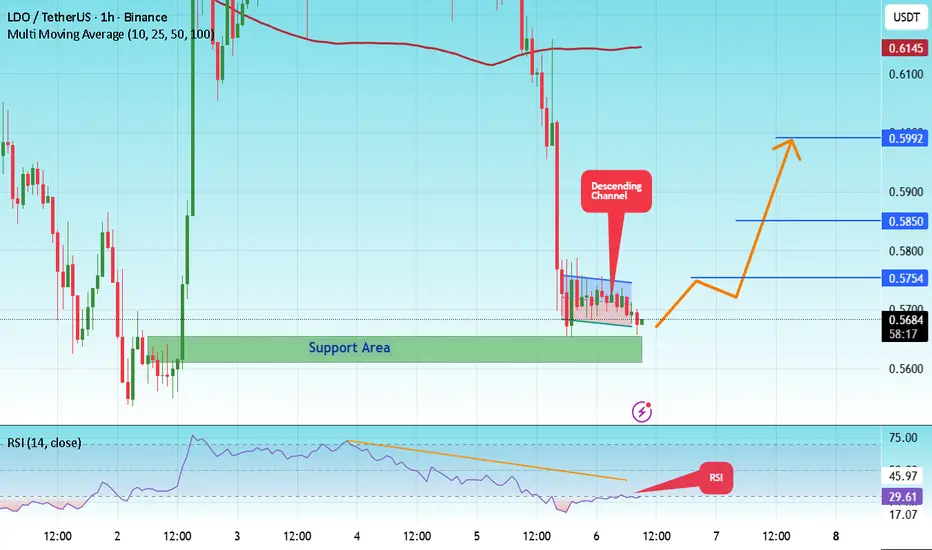
The price is moving in a descending channel on the 1-hour timeframe. It has reached the lower boundary and is heading towards a breakout, with a retest of the upper boundary expected.
We are seeing a bearish bias in the Relative Strength Index (RSI), which has reached near the lower boundary, and an upward bounce is expected.
There is a key support zone in green at 0.5635, and the price has bounced from this level several times. Another bounce is expected.
We are seeing a trend towards stabilizing above the 100-period moving average, which we are approaching, supporting the upward trend.
Entry Price: 0.5673
First Target: 0.5757
Second Target: 0.5850
Third Target: 0.5992
Remember a simple principle: Money Management.
Place your stop-loss order below the green support zone.
For any questions, please leave a comment.
Thank you.
TradeCityPro | LDO Support Zone: Is a Trend Reversal Coming?👋 Welcome to TradeCityPro!
In this analysis, I want to review the LDO coin for you, one of the DeFi projects with a $634 million market cap, currently ranked 87th on CoinMarketCap.
⏳ 4-Hour Timeframe
On the 4-hour timeframe, this coin is sitting on a very important support level, which has already been tested twice.
✔️ Overall, a downtrend is visible on the LDO chart, and breaking this support zone could allow the price to continue moving within this bearish structure.
⭐ If this support breaks, we can open a short position.The next support zone the price may head toward is 0.6229.
💥 If the coin gets supported at this level instead, the first long trigger will be the 0.7840 level.A stabilization above this level will be the first sign of bullish momentum returning.
💡 The main trend-reversal triggers are 0.8962 and 1.0209.For spot buying, we can wait for a breakout of these levels.
🛒 However, for spot entries, besides these triggers, I also wait for confirmation from macro indicators such as Others.D and BTC.D.I do not enter based solely on price confirmation.
📝 Final Thoughts
Stay calm, trade wisely, and let's capture the market's best opportunities!
This analysis reflects our opinions and is not financial advice.
Share your thoughts in the comments, and don’t forget to share this analysis with your friends! ❤️

#LDO/USDT — Critical Retest at Demand Zone vs Long-Term Downtr#LDO
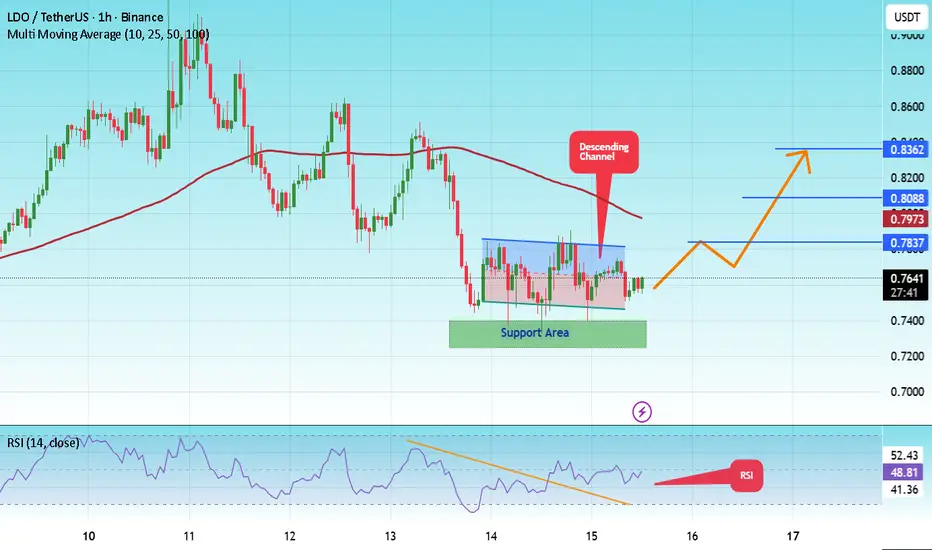
The price is moving in a descending channel on the 1-hour timeframe and is expected to break out and continue upwards.
We have a trend to stabilize above the 100-period moving average again.
We have a downtrend on the RSI indicator, which supports an upward move if it breaks above it.
We have a key support zone in green that pushed the price higher at 0.7330.
Entry price: 0.7643
First target: 0.7837
Second target: 0.8088
Third target: 0.8362
For risk management, don't forget stop-loss orders and capital management.
The stop-loss is below the support zone in green.
Upon reaching the first target, take some profits and then change the stop-loss order to an entry order.
For any questions, please comment.
Thank you.
Lido DAO ($LDO) hourly chart shows a TD Sequential sell signal. Lido DAO ( MIL:LDO ) hourly chart shows a TD Sequential sell signal.
Monitor $1.45 support; a drop below could target $1.30 or $1.20.
LDO gained 4.27% in the last 24 hours, surpassing the crypto market’s 2.22% rise, after a 70% weekly jump.
Key factors:
Record TVL & Holding: Lido’s TVL reached $38.17B, with $1.71M net outflows reflecting strong accumulation.
Ethereum’s Surge: CRYPTOCAP:ETH approaching $4,500 boosts MIL:LDO , the top liquid staking protocol. .
#LDO/USDT — Critical Retest at Demand Zone vs Long-Term Downtr#LDO
The price is moving within an ascending channel on the 1-hour timeframe and is adhering to it well. It is poised to break out strongly and retest the channel.
We have a downtrend line on the RSI indicator that is about to break and retest, which supports the upward move.
There is a key support zone in green at 0.7400, representing a strong support point.
We have a trend of consolidation above the 100-period moving average.
Entry price: 0.7514
First target: 0.7640
Second target: 0.7879
Third target: 0.8140
Don't forget a simple money management rule:
Place your stop-loss order below the green support zone.
Once you reach the first target, save some money and then change your stop-loss order to an entry order.
For any questions, please leave a comment.
Thank you.

LDOUSDT 3D#LDO is currently trading within a descending channel on the 3-day timeframe. It’s attempting a recovery after finding support near the lower Bollinger Band and the channel’s midline.
If momentum continues and LDO reaches the upper Bollinger Band, it could retest the channel resistance and potentially break to the upside. A confirmed breakout may open the way toward the following targets:
🎯 $1.3821
🎯 $1.8134
🎯 $2.1620
🎯 $2.5106
🎯 $3.0000
⚠️ Always use a tight stop-loss and maintain proper risk management.

#LDO/USDT — Critical Retest at Demand Zone vs Long-Term Downtr#LDO
The price is moving in a descending channel on the 1-hour frame and is expected to break and continue upward.
We have a trend to stabilize above the 100 moving average once again.
We have a downtrend on the RSI indicator that supports the upward move with a breakout.
We have a major support area in green that pushed the price higher at 0.8568.
Entry price: 0.9144.
First target: 0.9520.
Second target: 0.9971.
Third target: 1.04.
To manage risk, don't forget stop loss and capital management.
When you reach the first target, save some profits and then change your stop order to an entry order.
For inquiries, please comment.
Thank you.

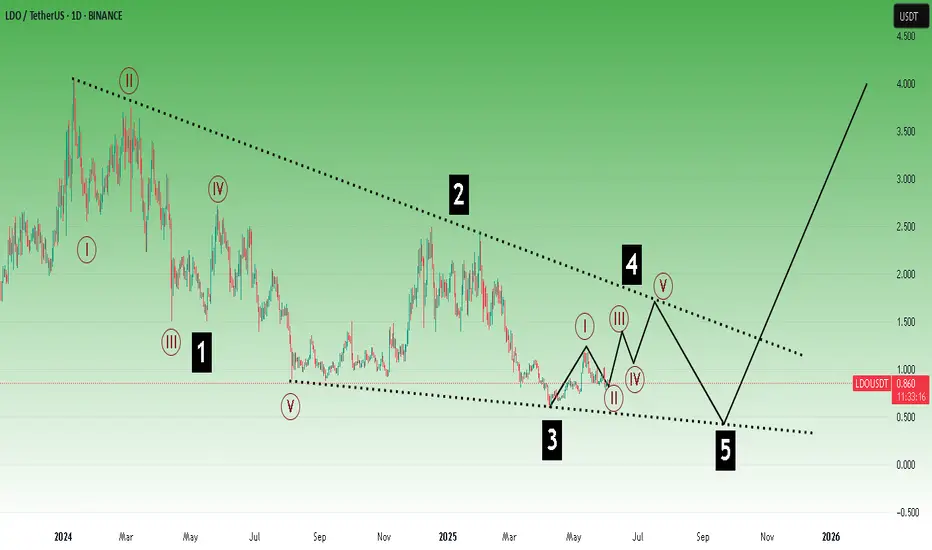
LDO ROADMAPTo me the view is pretty clear.
* The purpose of my graphic drawings is purely educational.
* What i write here is not an investment advice. Please do your own research before investing in any asset.
* Never take my personal opinions as investment advice, you may lose your money.
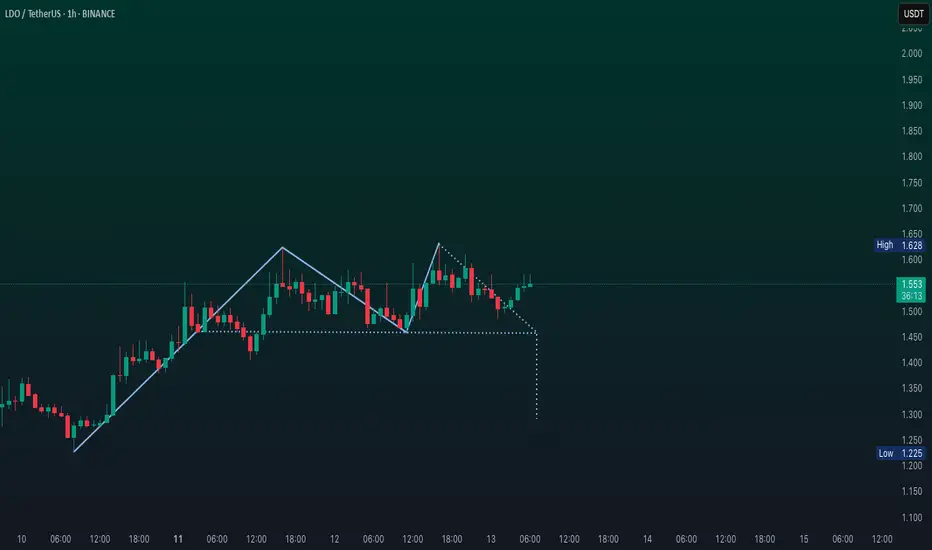
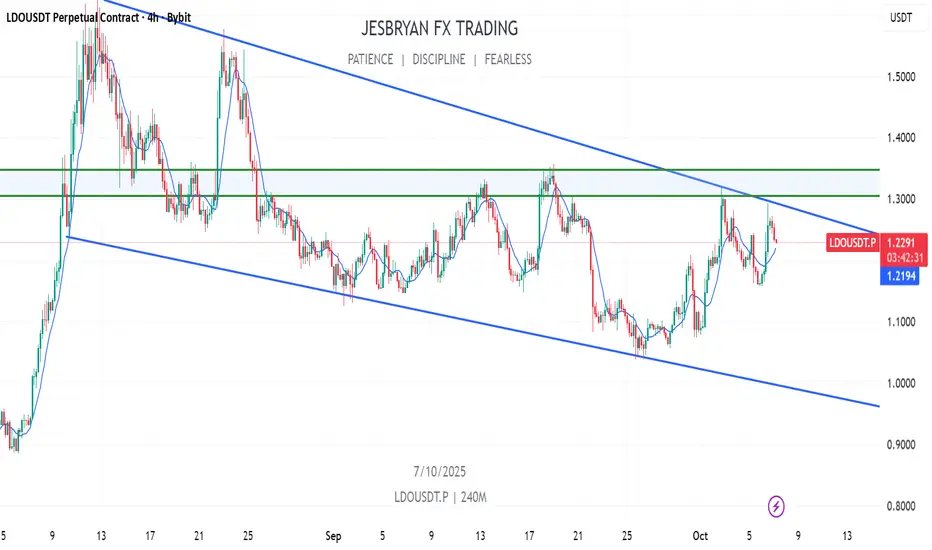
LDO analysisPrice is trading in a downtrend channel on the hourly chart. The price is trying to break the resistance line, but is being rejected from there. We will open a new long position once the price holds above the resistance area.
Resistance Area: $1.30-$1.35
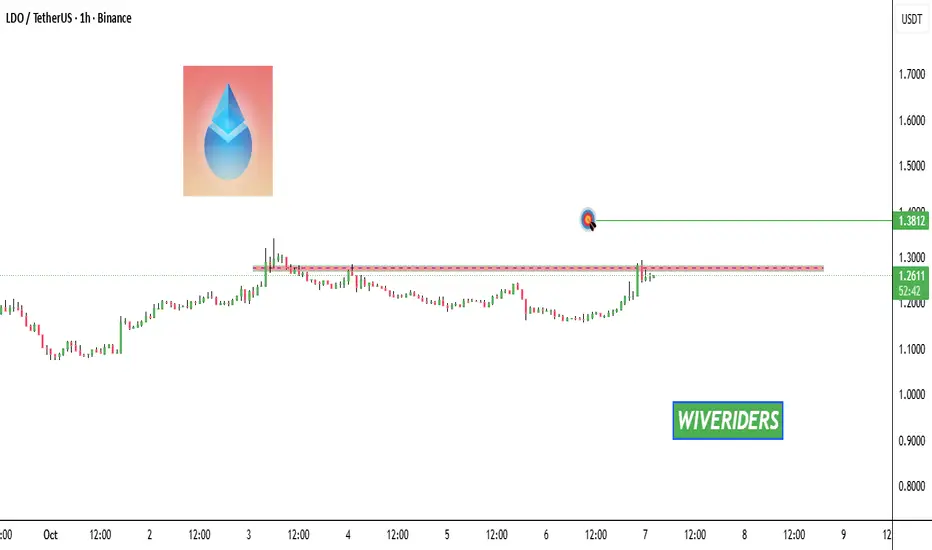
LDO Update📊 LDO Update
LDO is testing the red resistance zone — watch closely 👀
If it breaks out, the first target will be the green line level 🚀
LDO Is Coiling for a Massive Move — But Will It Be Up or Down?
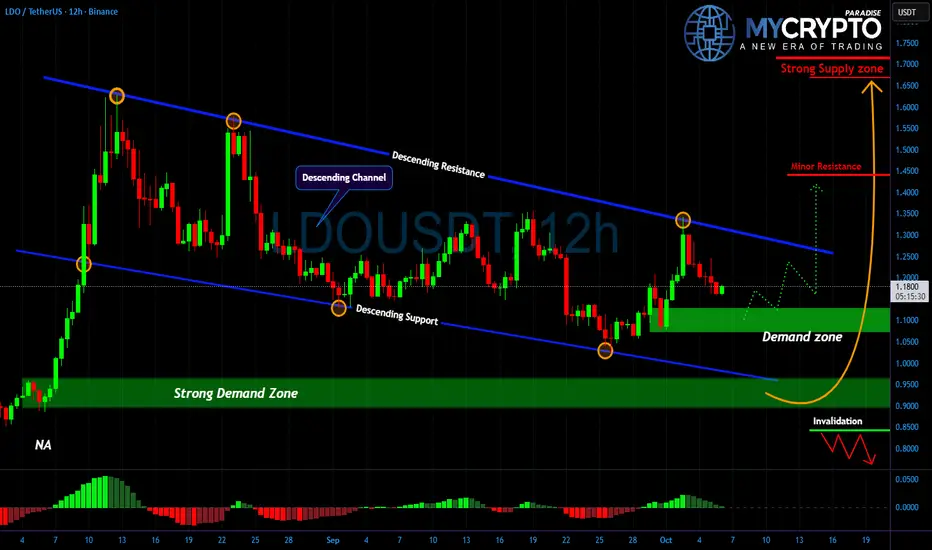
Yello Paradisers, are you ready for what could be one of #LDO’s most explosive reversal plays of Q4? After weeks of tight compression inside a well-defined descending channel, price action is now approaching a make-or-break demand zone and what happens next could define LDO’s direction for the rest of the year.
💎#LDOUSDT has been moving within a steady downward-sloping structure, with each touch of the lower boundary triggering a defensive bounce by buyers. This repeated defense shows that demand is still active at the lows, but the recent rejection from the channel top wasn’t followed by strong continuation. Instead, momentum indicators are flattening out, suggesting that bears may be losing control.
💎Now, price is pressing into a major demand area where high-probability long setups are beginning to form. If bulls step up here and manage to hold the zone while forming a clear higher low, an impulsive move toward the minor resistance near $1.35 could follow and from there, a rally toward the strong supply region between $1.65 and $1.70 becomes a real possibility.
💎However, if this demand zone gives way and we see a sustained breakdown below $0.85, the entire setup would be invalidated. That kind of move would likely trigger another round of selling pressure and take out weak hands who entered prematurely. Until that point, there’s no need to rush. The structure remains intact and the risk-to-reward is highly favorable — but only for those patient enough to wait for confirmation.
The market rewards patience, not emotions. Don’t guess — prepare. The setup is clean, but timing is everything.
MyCryptoParadise
iFeel the success🌴
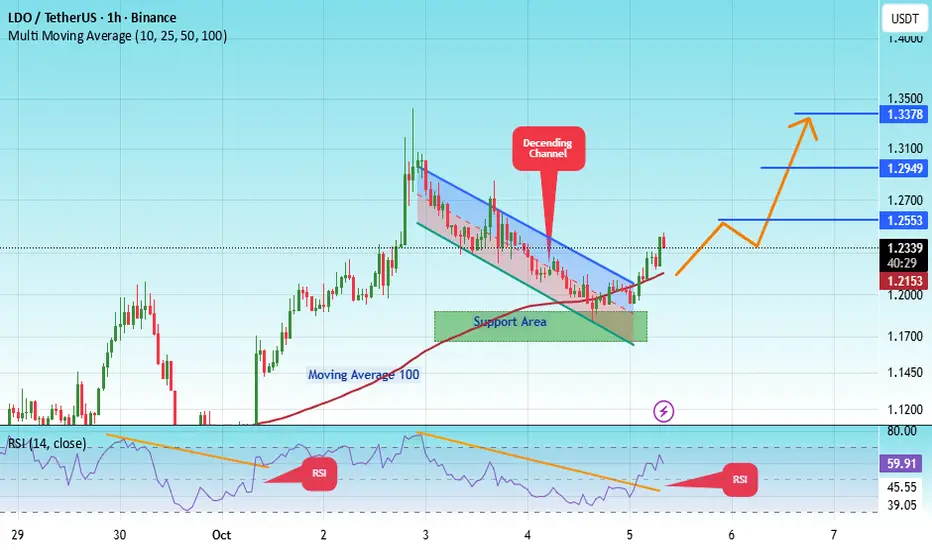
#LDOUSDT Analysis — Pullback Before Bullish Continuation
#LDO
The price is moving within a descending channel on the 1-hour frame, adhering well to it, and is heading for a strong breakout and retest.
We have a bearish trend on the RSI indicator that is about to be broken and retested, which supports the upward breakout.
There is a major support area in green at 1.17, representing a strong support point.
We are heading for consolidation above the 100 moving average.
Entry price: 1.23
First target: 1.25
Second target: 1.30
Third target: 1.34
Don't forget a simple matter: capital management.
#LDO/USDT — Critical Retest at Demand Zone vs Long-Term Downtre#LDO
The price is moving within a descending channel on the 1-hour frame, adhering well to it, and is heading for a strong breakout and retest.
We have a bearish trend on the RSI indicator that is about to be broken and retested, which supports the upward breakout.
There is a major support area in green at 1.04, representing a strong support point.
We are heading for consolidation above the 100 moving average.
Entry price: 1.10
First target: 1.14
Second target: 1.20
Third target: 1.27
Don't forget a simple matter: capital management.
When you reach the first target, save some money and then change your stop-loss order to an entry order.
For inquiries, please leave a comment.
Thank you.

A Bullish Opportunity for Lido DaoThe price of Lido DAO (LDO) is at a critical point right now, according to technical analysis on the weekly timescale. It is testing the Double Bottom pattern's neckline around US$1.1108 and is also making an effort to break through the 8-EMA resistance at US$1.1957. The price has a broad range of potential for upward movement if it can effectively break out of the 8-EMA level and reject the neckline without dropping below the bullish trendline that supports it. The initial objective is about US$1.5683, and a more optimistic target is around US$2.1888.

Here is the good long opportunity 👉The price has perfectly bounced from the trend line and has now broken out of the key $0.17 resistance area. From here, I expect a new bullish move and a breakout from the bull flag toward a 1.4$, 1.63$, 1.8$, Here a is the good area to enter this position

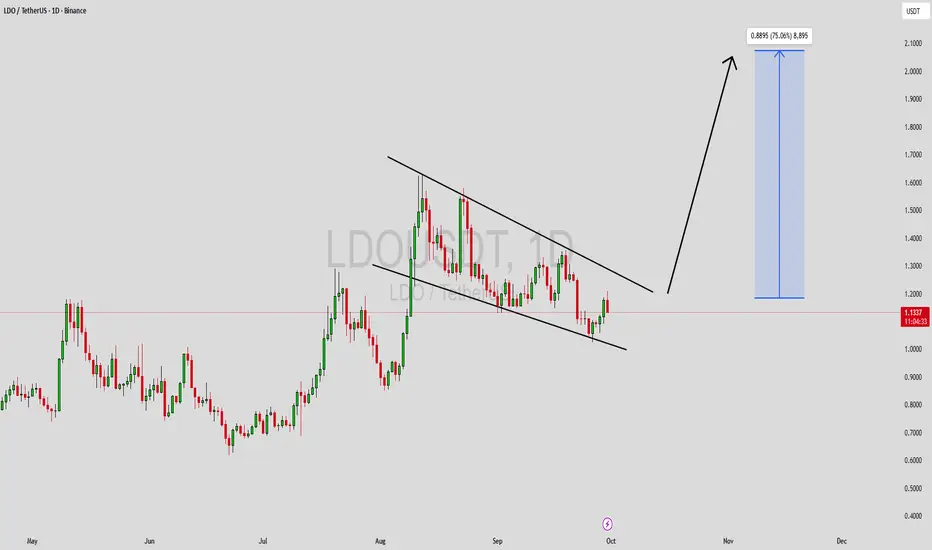
LDOUSDT Forming Falling WedgeLDOUSDT is currently shaping a falling wedge pattern, a classic bullish reversal signal in technical trading. This structure reflects consistent price compression with lower highs and lower lows, but the momentum of sellers is steadily weakening. When combined with strong volume, this setup becomes a high-probability breakout formation, pointing to a potential upside of 60% to 70%+ once resistance levels are cleared.
The falling wedge often precedes explosive breakouts as market participants recognize the shift in momentum. For LDOUSDT, a breakout confirmation above its upper trendline could trigger strong buying interest, inviting both short-term traders and long-term investors to enter positions. This could result in a sharp price acceleration toward higher resistance levels, fueling a sustained bullish trend.
Investor attention toward this project is also on the rise, strengthening the fundamentals behind the technical setup. The combination of favorable sentiment, healthy trading activity, and clear chart structure makes LDOUSDT an attractive opportunity for those seeking strong risk-to-reward trades in the current market environment.
✅ Show your support by hitting the like button and
✅ Leaving a comment below! (What is You opinion about this Coin)
Your feedback and engagement keep me inspired to share more insightful market analysis with you!
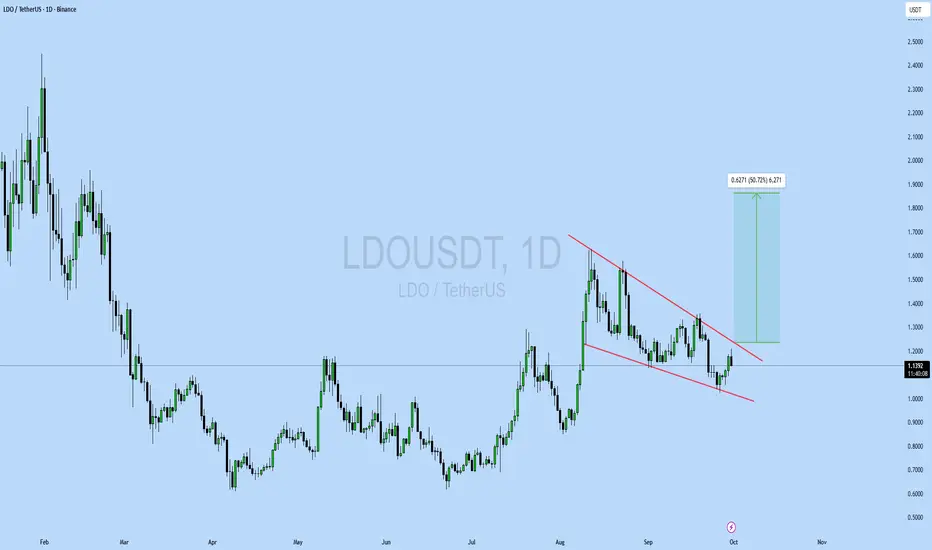
LDOUSDT UPDATE#LDO
UPDATE
LDO Technical Setup
Pattern: Bullish falling wedge breakout
Current Price: $1.138
Target Price: $1.76
Target % Gain: 50.72%
LDO is breaking out of a falling wedge on the 1D timeframe, signaling a bullish reversal with upside potential toward $1.76. Momentum favors continuation if buyers sustain pressure. Always use proper risk management.
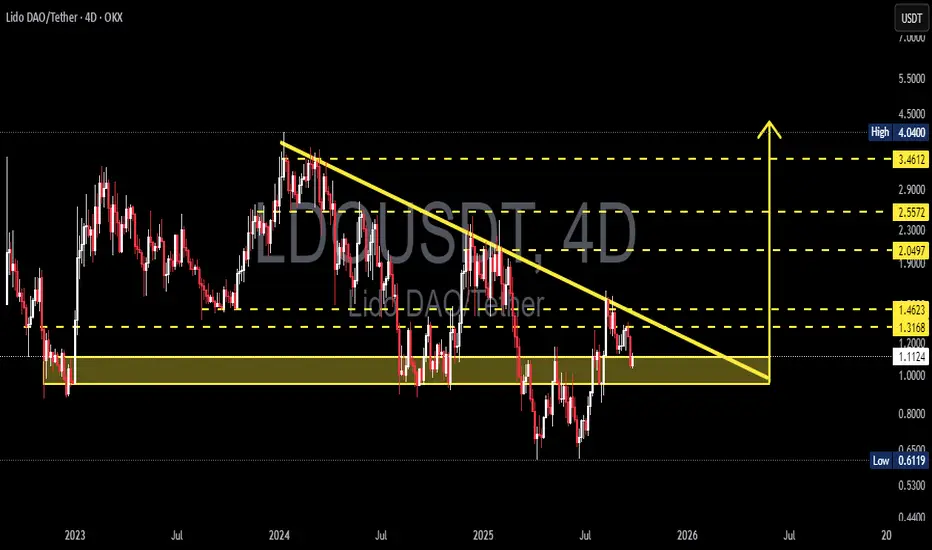
LDOUSDT — Critical Retest at Demand Zone vs Long-Term Downtren!Lido DAO (LDO) is currently sitting at a make-or-break level. The chart shows price being squeezed between a long-term descending trendline from the 2023–2024 highs and a strong demand zone around $1.00–1.12. This setup signals a major decision point: either a bullish reversal is about to begin, or bearish continuation will take over.
---
🔎 Key Technical Structure
Descending Trendline: consistent lower-highs pressuring every bounce → sellers still in control on the bigger picture.
Demand Zone $1.00–1.12: highlighted in yellow, repeatedly acting as strong support → buyers are defending aggressively.
Support vs Resistance Clash: the meeting point of horizontal demand and the trendline creates a descending triangle-like structure. Typically bearish, but if demand holds, it could trigger a powerful reversal breakout.
---
🚀 Bullish Scenario
Confirmation: 4D close above the trendline and $1.46.
Upside targets:
$2.05 (Target 1, key resistance)
$2.55 (Target 2, prior supply area)
$3.46 (Target 3, major resistance)
Potential upside: +80% to +210% from current levels if breakout is strong.
---
🔻 Bearish Scenario
Confirmation: 4D close below $1.00 support.
Downside target: retest of structural low at $0.61.
Potential downside: about -45% from current levels.
---
⚖️ Conclusion
LDO is at a critical decision zone:
Break above $1.46 → opens the door to $2–3+ rally.
Breakdown below $1.00 → likely continuation toward $0.61.
For swing traders, this is a moment to wait for confirmation before committing to a major position. This demand zone could be the foundation for accumulation or the beginning of deeper downside.
---
📢 Note
Always wait for candle close (4D/1W) + volume confirmation before entering. This analysis is for educational purposes only — not financial advice.
---
#LDO #LDOUSDT #LidoDAO #DeFi #Crypto #TechnicalAnalysis #Breakout #SupportResistance #SwingTrade
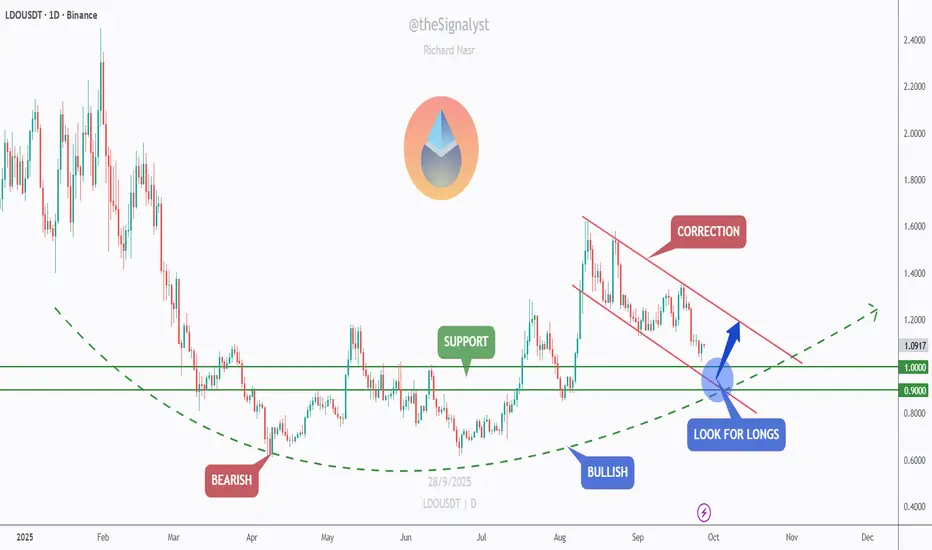
LDO – Waiting at the $1 ConfluenceLDO is overall bullish and currently in a correction phase inside a falling red channel. I’m waiting for price to reach the confluence of the support zone + round number $1.00 + lower red trendline. That intersection is where I’ll look for longs if we get a clear bullish reaction.
If we bounce: first targets $1.15–$1.20, then $1.30–$1.40 (channel top). A clean break/retest above $1.10 would add confirmation.
Invalidation: a daily close below $0.90 would put the setup on hold.
Does the $1 confluence hold and kick off the next leg up? 🤔
⚠️ Disclaimer: This is not financial advice. Always do your own research and manage risk properly.
📚 Stick to your trading plan regarding entries, risk, and management.
Good luck! 🍀
All Strategies Are Good; If Managed Properly!
~Richard Nasr